Nonlinear Spillovers from Stock, Gold, Oil, and T-bill Volatilities to Predict Economic Policy Uncertainties
Rukhsana Bibi 1,2* , Mobeen Aslam Butt1, Naveed Raza1, and Kalsoom Akhtar3
1Department of Management Sciences, COMSATS University, Islamabad, Pakistan
2National University of Modern Languages, Islamabad, Pakistan
3Department of Tourism and Hospitality Management, The Islamia University of Bahawalpur, Pakistan
ABSTRACT
Economic policy uncertainity (EPU) shapes the economic development of a country and any instability in policy results in financial markets downturn. Several elements are considered as predictors of EPU. Of these, commodities (oil, gold) are the most common. This study consider financial markets with four major asset classes gold, crude oil, 10-year treasury bonds, and stock prices to examine a nonlinear and asymmetric spillover that influences EPU. The dataset comprises oil price volatility, gold price volatility, T-bills volatility, stock price volatility, and the EPU index of eight countries. NARDL model is used to capture the impact of the nonlinear behavior of uncertainties on gold, oil, T-Bills, and stock market volatilities. It captures both long-run and short-run non-linearities by separating explanatory variables into partially positive and partially negative components. The outcomes reveal positive and negative shocks to oil price volatility, gold price volatility, T-Bills volatility, and stock price volatility which positively affect the EPU of all countries. However, Canada does not bear any effect of negative shocks in the short-run to gold price and oil price volatilities to predict the EPU. USA shows the negative impact of negative shocks for all asset classes. T-Bills derived negative shocks adversely affect China at 5% level of significance. Furthermore, the effect of positive shocks is more pronounced than negative shocks. The outcomes support the short-run and long-run asymmetric impact of oil, gold, T-Bills, and VIX volatilities to predict EPU. This study helps investment funds in managing risk, asset pricing, and formulating economic policy differentiated to positive and negative shocks.
1. INTRODUCTION
Financial and political events determine economic policy uncertainty (EPU) around the globe and financial markets are affected negatively due to such events (Al-Thȃqeb et al., 2020; Yousfi et al., 2021). Uncertainty can be transmitted from one market to another due to the close links between them (Kang & Yoon, 2019). EPU has a strong influence on stock markets, on commodities markets (Peng et al., 2018; Phan et al., 2018), and on other countries’ economic institutions (Gabauer & Gupta, 2018; Jiang et al., 2019; Yoon et al., 2019). It has significant implications for investment strategies and decision-making processes and plays an important role in analyzing the business cycle. Economic activity is affected by the change in EPU. The link between commodity volatility and economic activity is evident in the literature (Aharon, 2018; Gabauer & Gupta, 2018; Rehman & Vo, 2021). Therefore, predicting EPU has significant implications for academics, policy formation, and investments, considering the business cycle. For manufactured goods, basic commodities are input and any price change instantaneously affects production cost. The theory of storage states that future prices reflect future market demand and supply for commodities (Bannigidadmath & Narayan, 2021). Wang et al. (2015) stated that the commodities price change is an important element to predict EPU. Since commodity prices are decided on a public scale, thus prices are immediately available and respond at once to the economic situation and EPU. Many primary commodities such as crude oil are used in the production of manufactured goods. So, a small change in its price directly impacts the cost of production.
Oil is an essential element in the economic development of a country (Ma et al., 2017; Shahbaz et al., 2018; Zhang et al., 2018). High volatility in oil prices negatively affects the stability of financial markets (Ma et al., 2021). Oil price volatility raises inflation, whilst gold resists against price rises due to its monetary nature (Dai & Zhu, 2023). Therefore, it is important to consider the commodity market volatility while formulating economic policies because commodity prices provide valuable information for future EPU. Fluctuations in commodity prices are also a leading indicator of EPU (Wang et al., 2015). For instance, (Bannigidadmath & Narayan, 2021; Berger & Uddin, 2016; Șhahzad et al., 2019; Deev, 2022; Xiao et al., 2022) found significant dependence between commodities and economic uncertainty. Bloom (2014) reported a significant impact of EPU on asset prices and portfolio returns. Awokuse and Yang (2003) argued that commodity prices are a source of information in monetary and fiscal policy formulation. This linkage between commodities and policy processes is substantial. It is believed that EPU index helps to stabilize financial markets (Zhu et al., 2022).
Long-term price equilibrium exists in oil and metal markets but not in gold and agricultural commodity prices. (Zhang, Yang & Liu, 2021). Oil and gold markets are more exposed to market dimensions (Yuan et al., 2022). Oil and gold are strategic commodities which play an irreplaceable role in the world economy. Any rise and fall in their prices have significant effects on financial market trends (Kopyl & Lee, 2016).
Several studies have paid attention to the link between EPU and volatilities of commodity prices (Bibi et al., 2024; Fang et al., 2018; Shahzad et al., 2019; Zhang, Abbas et al., 2021). Other scrutinized the connection and correlation of EPU with oil, gold, and other financial assets (Fang et al., 2017; Mokni et al., 2020). Ren et al. (2022) examined the EPU-derived risk to commodity market futures of USA using quantile regression. The aim was to determine the effect of risk spillover from oil, gold, treasury bills (T-Bills), and stock volatilities to predict EPU. Bibi et al. (2024) analyzed global spillover of volatilities (gold, oil, T-Bills, VIX, and EPU) to equity stock markets of Canada, UK, USA, and Japan. They found a weak correlation between EPU and stock market indices. Whereas, a strong correlation was evident between the volatility of VIX and stock markets.
This study addresses an important aspect of economic-financial studies, that is, using spillover from commodities to predict EPU. EPU is an indicator of uncertainty (Phan et al., 2018) which is closely linked to commodity markets. For the USA, the association between oil price and EPU was examined by (Aloui et al., 2016; Wang et al., 2015), while ignoring the role of other commodities for other countries. Saeed et al. (2023) examined risk spillover from energy markets toward four commodity markets in Pakistan. Wang et al. (2015) used 23 commodities for the USA only. Dai and Zhu (2023) investigated the dynamic risk spillover between EPU, gold, crude oil, and the four financial sectors of China. Theoretically, any change in oil prices directly affects businesses and households. Oil is crucial in manufacturing goods and services. Oil prices influence firm value and the discount rate applied to cash flows. Consequently, oil price shocks influence stock market returns (Mohanty et al., 2018) and stock market uncertainty-VIX (Shahzad et al., 2019).
This paper contributes to expand the sample to eight countries (UK, USA, China, Canada, France, Germany, Italy, and Spain) using volatility indices of gold, oil, T-Bills, and VIX. It also adds-up 10-year T-Bills volatility because treasury bonds are a reliable asset during financial markets turbulence (Liu & Lee, 2022; Gupta et al., 2021; Tachibana, 2022). CBOE implied volatility index provides new ways to measure the uncertainties which are pivotal to forecast stock market trends and act as a hedge (Basher, 2016; Raza et al., 2016; Shu & Chang, 2019). VIX reveals market uncertainty. Thus, the implied volatility indices are vital to formulate economic policies which might provide evidence for upcoming policy uncertainty. This study attempts to provide empirical evidence of nonlinear spillover from gold, oil, 10-year US T-Bills, and VIX volatilities to predict EPU.
Literature Review
To deal with economic instability, the government takes various measures. EPU and its consequences for financial markets have drawn the interest of academics. The interconnectedness between EPU and commodities markets was examined by (Zhu et al., 2021, 2020; Yin et al., 2023). With economic breakdown, commodities experience a significant fall in prices. In low and high regimes, commodity markets are stimulated by EPU (Xiao et al., 2022). Due to frequent and uncertain price changes in commodity markets and high demand from investors, the study of these markets is of great concern (Rajput et al., 2021). Several studies have been conducted on commodity markets uncertainties keeping in view their theoretical and empirical aspects. Still, the academics remain concerned about the effects of EPU. Economic crisis of 2019 led to the transmission of financial distress to the whole economy (Li, 2021). Such a risk spillover to international markets is a natural consequence of these types of events (Wei & Han, 2021). Policy formation is a key indicator in commodity markets. Economic policies are designed to ensure a steady growth of domestic markets. Hence, examining the spillover from commodity markets–oil, gold, T-Bills, and VIX to predict EPU has practical importance. Gupta et al. (2021) found that 10-year T-Bills proved to be safe during the Global Financial Crisis 2008-09 and COVID-19, whereas 3-year T-Bills proved to be weak safe haven security. Numerous studies have examined how stock markets experience significant fluctuations driven by microeconomic and macroeconomic uncertainties, including recessions, inflation, interest rate changes, and oil price volatility, all of which contribute to broader economic uncertainty (Anser et al., 2020; Khokhar et al., 2020; Mohsin et al., 2021). The circumstances that cause market fluctuations might be described by EPU or volatility.
Volatilities and returns of commodities are influenced by financial conditions (Rajput et al., 2021). According to Yu et al. (2021), there exists a dynamic relationship between global oil prices and Chinese commodity and stock markets. Global macroeconomic variables affect the various stages of commodity price cycle. Commodities serves as a hedge and a source of portfolio diversification (Kim & Yasuda, 2021). Commodity markets experience symmetric volatility with less positive fluctuations.
Such variations in commodities lead to significant changes in economic growth (Scarcioffolo & Etienne, 2021). Crude oil volatility is negatively affected by economic turmoil to a greater extent than gold prices (Yuan et al., 2022). An opposite leverage impact was examined for crude oil among other commodities (He et al., 2020; Kim et al., 2019; Shen et al., 2021; Xiang & Qu, 2020). There exists a long price equilibrium in metals and oil markets, as reported by Zhang, Yang and Liu (2021). It has been shown that gold and oil prices are more receptive to market conditions (Yuan et al., 2022). According to Zhou et al. (2021), gold futures can be treated as a commodity to safeguard stock market losses. Due to financialization, commodity futures appear as distinct assets.
Several studies have analyzed the relationship between commodities and other assets. Chen et al. (2020) examined volatility between credit default swaps and commodities. Commodities, energy, and metals have the strongest impact because volatility transmission depends on commodity type. According to Dash and Maitra (2021), there exists a strong correlation among stock markets and commodities of USA and BRICS countries. An ever-shifting network structure between different assets has been uncovered at national and international levels. Asymmetric volatility spillover among energy and commodities was postulatd by Wang and Li (2021). Oil provided larger modification benefits than other commodities selected in the sample (Aloui et al., 2016). There exists an asymmetric and steering attitude that varies in the markets (Aslam et al., 2022). Studies show that commodities have a substantial influence on financial and economic systems. Given the importance to economic fluctuations and sensitivity of commodity prices, this study examines if nonlinear spillover from stock prices VIX and commodity markets–oil, gold, and T-bills can predict the EPU of USA, UK, China, Canada, France, Germany, Italy, and Spain.
Data and Analysis
Data
The monthly data of EPU indices of France, Germany, Italy, Spain, UK, Canada, China, and the USA is used in this research. The volatility of four different asset classes including stock (VIX), gold (GVZ), crude oil (OVX), and treasury bills (TBVIX) is used to determine the source of uncertainty that is most prone to causing global risk. The data collection period spans from June 2008 to November 2016, which covers the most recent European debt crisis of 2010-12 and 2015 Chinese stock market crash period. The entire data is sourced from DataStream International. Prior studies focused on analysing the severe impact of volatilities (crude oil and gold) on stock returns (Raza et al., 2016). In the same vein, the current study explains that these volatilities have definitely resulted in policy changes in selected countries.
Empirical Model
In the current study, the nonlinear auto-regressive distributed lag (NARDL) model is used to determine short- and long-run dynamics between Economic Policy Uncertainty (EPU) and CBOE gold volatility (GVZ), oil volatility (OVX), 10-year US treasury bill volatility (TBVIX), and US implied volatility index (VIX). This method can be used regardless of the integration order with the exclusion that the series are co-integrated with the maximum order (Ghatak & Siddĩki, 2001). The order of integration is further confirmed by the unit root tests. Nonlinear cointegration is implied if the time series are cointegrated using positive and negative components (Granger & Yoon, 2002).
The asymmetries in the relationship are caused by the noisy trader, nonlinear transaction costs, and excessive volatility or asymmetric adjustment processes. If the sample includes extremely volatile regimes undergoing financial crises, the time series gains great credibility. The method of nonlinear cointegration is stated as follows:
This makes it possible to use positive and negative partial sum decomposition to identify imbalances in relationships over the long- and short-terms (Narayan, 2005), which provides robust results (Huang et al., 2022; Lahiani et al., 2016; Raza et al., 2016). It permits a joint analysis of the problems of non-stationarity and non-linearity using the unrestricted error correction model. Shin et al. (2014) specify non-linear cointegration regression as follows:
where and are the long-term parameters of k × 1 vector of regressors , decomposed as:
Where the partial sums of positive and negative changes in are:
The NARDL(p, q) model in asymmetric error correction form is:
Where and .
The first two steps in a nonlinear framework to determine the cointegration relation between variables remain the same as in the linear ARDL framework: estimate equation (6) using OLS and conduct a joint null hypothesis test .
The Wald test is used to evaluate long-run () and short-run () asymmetries in the relationship. Finally, asymmetric cumulative dynamic multiplier effects of a unit change in and on are defined as:
As , then and . These are the asymmetric long-run coefficients and can be computed as and respectively.
Results
Descriptive Statistics
Table 1 presents the descriptive statistics. EPU indices have positive mean values of France, Germany, Spain, China, Canada, and the UK, which indicates that there was higher or significant EPU in these countries during the sample period. However, the mean values of the EPU indices of Italy and US are negative which portrays favourable economic conditions in these countries. Further, the volatility indices which measure implied volatility over the next 30 days of their respective markets are negative. The standard deviation is highest for EPU indices and lowest for volatility indices. USA is the most volatile and Canada is the least volatile country. Treasury bills are less volatile and VIX are the most volatile. The excess kurtosis indicates that all time series are positively skewed and have a fat tail. Moreover, all these stylized facts are also supported by J-B statistics which reject the null hypothesis of normality.
Table 1 Descriptive Statistics| Variable | M | Median | Max. | Min. | SD | Skewness | Kurtosis | Jarque-Bera |
|---|---|---|---|---|---|---|---|---|
| Canada | 0.66 | -3.14 | 68.49 | -66.91 | 27.64 | 0.354 | 3.138 | 2.17*** |
| China | 0.86 | 2.26 | 165.61 | -176.69 | 51.17 | -0.087 | 4.510 | 9.63*** |
| France | 0.78 | 0.04 | 88.48 | -100.0 | 34.05 | -0.170 | 3.285 | 6.82*** |
| Germany | 0.35 | 2.53 | 123.3 | -72.38 | 35.79 | 0.193 | 3.142 | 5.70*** |
| Italy | -0.23 | 0.40 | 99.51 | -82.37 | 30.48 | 0.301 | 4.263 | 8.16*** |
| Spain | 0.15 | 2.30 | 85.26 | -80.30 | 37.01 | -0.074 | 2.286 | 2.21*** |
| UK | 1.08 | 1.23 | 71.06 | -81.08 | 28.56 | -0.190 | 3.072 | 3.62*** |
| USA | -1.02 | -11.29 | 170.2 | -197.6 | 64.60 | 0.069 | 3.269 | 3.38*** |
| GVZ | -0.82 | -2.20 | 58.07 | -30.80 | 17.67 | 0.987 | 4.315 | 23.43*** |
| OVX | -0.10 | -0.78 | 34.94 | -39.25 | 15.74 | 0.208 | 3.000 | 6.723*** |
| TBVIX | -0.55 | -1.22 | 49.16 | -32.26 | 14.70 | 0.582 | 4.228 | 11.94*** |
| VIX | -0.63 | -2.04 | 85.26 | -48.60 | 22.90 | 0.647 | 4.343 | 14.48*** |
Unit Root Analysis
Table 2 presents stationarity checked through ADF, PP, and KPSS tests. The sample variables are not stationary at level, although they become stationary at first difference. The selected variables are stationary at first difference and the non-linear-ARDL approach provides fair outcomes. Further, bound testing is used for the cointegration test in a nonlinear manner.
Table 2 Unit Root Analysis| Series | ADF | PP | KPSS | |||
|---|---|---|---|---|---|---|
| Level | 1st Dif | Level | 1st Dif | Level | 1st Dif | |
| Canada | -4.6378 | -7.4467*** | -4.5943 | -12.5435*** | 0.2452*** | 0.1504 |
| China | -1.7914 | -14.0549*** | -4.9250 | -16.3475*** | 0.2148*** | 0.0647 |
| France | -3.5600 | -8.3162*** | -5.7772 | -26.328*** | 0.5552*** | 0.1480 |
| Germany | -5.4112 | -13.5099*** | -5.3568 | -19.8262*** | 0.2780*** | 0.0914 |
| Italy | -3.8763 | -16.1112*** | -5.5385 | -22.9081*** | 0.2850*** | 0.3716 |
| Spain | -3.2028 | -9.6368*** | -6.2655 | -31.3173*** | 0.3083*** | 0.5000 |
| UK | -2.5924 | -13.4345*** | -3.2358 | -15.6056*** | 0.4288*** | 0.1225 |
| USA | -2.5492 | -11.4848*** | -6.3681 | -24.2584*** | 0.9597*** | 0.0636 |
| GVZ | -3.0004 | -10.7205*** | -3.0063 | -11.045*** | 0.7493*** | 0.0549 |
| OVX | -2.1151 | -9.1249*** | -2.3085 | -9.1165*** | 0.3205** | 0.0640 |
| TBVX | -2.6292 | -12.0227*** | -2.4724 | -12.5199*** | 0.8609*** | 0.0358 |
| VIX | -3.1424 | -12.1755*** | -3.1424 | -14.0571*** | 0.8988*** | 0.0558 |
Bounds Test
Bounds test results for cointegration between EPU and the group of stock, gold, oil, and government bond volatilities are reported in Table 3. The FPSS and tBDM statistics of NARDL approach are higher than the upper bound critical value at standard levels of significance for all the sample countries. It indicates the presence of long-run asymmetric relations for all the countries. On the recommendation of (Shin et al., 2014), a traditional method for choosing critical values in and statistics has been opted, taking a maximum of four lags on each first differenced variable in testing the null hypothesis (no cointegration). Each test confirms the existence of a nonlinear long-run link between asset classes (gold, oli, T-Bills, and VIX) and EPU. Further, the analysis for short-run and long-run asymmetric effects of gold, oil, T-bills, and VIX stocks to predict EPU.
Table 3 Bounds Test| FPSS_Nonlinear | t_BDM | |
|---|---|---|
| Canada | 5.080*** | -5.668*** |
| China | 5.594*** | -6.569*** |
| France | 5.830*** | -6.936*** |
| Germany | 6.984*** | -7.604*** |
| Italy | 6.981*** | -7.776*** |
| Spain | 7.526*** | -7.822*** |
| UK | 3.409*** | -5.284*** |
| USA | 13.449*** | -10.585*** |
NRDL
Table 4 reports the short-term and long-term estimates of the non-linear impact of the volatilities of four different asset classes, namely gold (GVZ), crude oil (OVX), T-Bills (TBVIX), and stocks (VIX). It is evident from the results that the Wald test confirms the suitability of NARDL. It rejects the null hypothesis of a long-term symmetric relationship between EPU and GVZ, as well as OVX and VIX for all countries and between TBVX and EPU for China, Germany, Italy, and UK. Moreover, by comparing the effects of good and bad events, it can be concluded that for oil, gold, T-Bills, and stock market, good news triggers a stronger reaction than bad news.
Uncertainty shocks to EPU have a negative impact on their future prices. Previous month’s prices EPUt-1 cannot predict future prices. There is a shift in commodity prices with any change in the monetary and fiscal policies of the countries. In the short-run, ΔEPUt-2, there is a negative shift in EPU of China (-0.330***) at lag 2, while a positive shift is observed in the USA (0.193***) at lag 3.
Panel A presents the short-run effect of positive and negative shocks. The findings show that positive gold price shocks (GVZt-1+) have had a positive impact on the EPU of Canada: 0.360**, China: 0.261**, France: 0.267**, Germany: 0.129**, Italy: 0.134**, UK: 0.106**, and the USA: 0.21**. On the contrary, gold price shocks do not have any effect on the EPU of Spain. The short-run effect of positive shocks to gold prices (GVZt+) reveals a positive impact on EPU for France (0.719***) and Italy (0.725***). Previous month’s gold prices of Canada (1.004***) reveal next month’s prices at lag 1 and with 1.007*** at lag 4. USA also shows a positive impact of negative shocks on gold prices at lag 5 (0.535***). Short-run effect vanishes over time. There are many factors identified for changing EPU, but gold is one of the major commodities which play a significant role.
Panel B in Table 4 presents the results of the Wald test for the presence of an asymmetric relationship with gold, oil, T-Bills, and VIX to predict EPU. The Wald test rejects the null hypothesis of long-run and short-run symmetry for oil, gold, and stock price indices for all the sample countries. Considering gold prices, the results reject the null hypothesis for both short-run and long-run symmetry. This confirms the presence of short-run and long-run asymmetric behaviour with EPU. It also indicates that the coefficients of increase and decrease in gold, oil, and stock prices increase (decrease) uncertainty. However, for T-Bills volatility, the Wald test accepts the null hypothesis of short-run and long-run asymmetry for Canada, France, Spain, and the USA. The EPU of these countries shows an insignificant impact of negative long-term shocks on T-Bills volatility. Moreover, 10-year government bonds act as a safe haven for these countries in the long-run.
Long-run positive shocks LGVZ+ affect all sample countries, while negative shocks LGVZ− adversely affect Canada (−0.720***) only. Gold price volatility cannot impact the EPU of Canada. The Wald test approves asymmetries for all countries in the long-run.
Positive shocks for crude oil indices (OVXt-1+) show significance for all countries except Canada with the coefficient values 0.181, 0.804***, 0.688**, 0.824***, 0.488**, 0.508**, 0.300**, and 0.772***. These significant fluctuations in crude oil prices indicate that previous month’s prices predict future prices. This signifies a variation in the global economic environment and policy uncertainty. These short-term adjustments are more likely to be the result of uncertainties. It is evident that oil price uncertainty leads to EPU for all countries except Canada (0.181), which is a net oil-exporting industrialized economy. This indicates that negative shocks to oil prices do not play an enabling role in stimulating economic policy. However, negative shocks ΔOVXt-4− put a negative effect on the economic policy of the USA at lag 4 (−0.033***), which signifies the even-out condition of the USA.
A positive oil price shock (LOVX+) has positive and significant consequences on economic policies of China: 1.262***, France: 0.993**, Germany: 1.060***, Italy: 0.605***, Spain: 0.625**, UK: 0.636***, and the USA: 2.121*** at 1% and 5% significance level. It specifies that any positive shock to oil prices plays an empowering role in stimulating the policies of the above-mentioned economies. Negative shocks LOVX− put no influence on the EPU of all the selected countries.
Positive shocks to treasury bonds (TBVXt-1+) have a positive effect on all countries (Canada: 0.369**, China: 0.783**, France: 0.430**, Germany: 0.637**, Italy: 0.346**, Spain: 0.352**, UK: 0.596***, and the USA: 1.029***) at 1% and 5% level of significance. While, negative shocks reveal a negative impact on 10-year treasury bills volatility on the EPU of Canada, China, and the USA. Previous month’s T-Bills volatility cannot predict future prices.
In the case of short-run treasury bills, volatility plays a significant role in the EPU of USA at lag 1, 2, and 6 (1.503***, 2.503***, and 1.094**). T-Bills are good hedge instruments during high macroeconomic volatility periods. It includes counter-cyclical supply shocks and pro-cyclical shocks of low macroeconomic volatility.
In the long-run, positive shocks of T-Bills affect positively the EPU of all countries, while negative shocks adversely affect China (−0.864**) at 5% level of significance. Countries hold treasury bonds to minimize risk whenever any bad news affect economic policy, since treasury bonds act as safe securities in time of uncertainty.
Positive shocks in stock price volatility (VIXt-1+) reveal positive price adjustments in economic policy for all countries (Canada: 0.595***, China: 1.256***, France: 0.373**, Germany: 1.155***, Italy: 0.247***, Spain: 0.474**, UK: 0.408**, USA: 0.861***). Negative shocks (VIXt-1−) render a positive influence on EPU of Canada (0.386**). It suggests that financial market disorder has a positive impact on Canadian stock prices.
In the short-run, ΔVIXt+ positive shocks affect Germany, Spain and the USA positively at 1% level of significance and ΔVIXt-3+ affects Canada with 0.366** at 5% level of significance. ΔVIXt-5− negative stock price volatility shocks impose a negative impact on the EPU of the USA at lag 5 (−0.392***) and restore itself in a short span.
In Panel B, LVIX+ the effect of shocks in the long-run is experienced for all sample countries, while LVIX− negative shocks to VIX attribute positively to the EPU of Canada (0.843**) at 5% level of significance. For Canada, the intensity of positive shocks is higher as compared to negative shocks.
It is important to assume that the identical effect of positive and negative oil price shocks, gold price shocks, T-Bills price shocks, and stock price shocks on EPU are too restrictive. It is evident that the direction and degree of impact are asymmetric in many cases. Further, oil, gold, T-Bills, and VIX shocks have disparity in positive and negative shocks on EPU, which responds quickly to the increase or decrease in oil, gold, T-Bills, and stock prices. Due to positive integration with EPU, these asset classes are considered as safe havens in extreme cases. The asymmetric property of these commodities can be helpful to institutional arrangements like PCA (price cap regulation), market structure, and marketing leagues to adjust prices according to market. It is helpful for policymakers to comprehend the dynamics of EPU in oil, gold, T-Bills, and stock price shocks and in the development of macroeconomic policies. The shocks on EPU are worthwhile for the economies that heavily rely on such assets and open to fluctuations. Additionally, the asymmetries are vital to fund managers, businesses, and investors to safeguard against oil, gold, T-Bills, and stock price shocks. The results are consistent with Raza et al. (2016).
This work can be extended beyond 2016 to examine the findings that stand up to economic policy uncertainty and volatilities with COVID-19 pandemic.
Table 4 NARDL Estimation – Dependent Variable ∆EPUt| Panel A Short-run asymmetric effects |
||||||||
|---|---|---|---|---|---|---|---|---|
| Variable | Canada | China | France | Germany | Italy | Spain | UK | USA |
| Constant | 2.079*** | 2.705*** | 3.544*** | 3.452*** | 3.660*** | 3.732*** | 2.424*** | 5.320*** |
| EPUt−1 | -0.457*** | -0.637*** | -0.693*** | -0.777*** | -0.806*** | -0.813*** | -0.473*** | -0.364*** |
| GVZ+t−1 | 0.360** | 0.261** | 0.267** | 0.129** | 0.134** | 0.152 | 0.106** | 0.21** |
| GVZ−t−1 | -0.329 | -0.021** | 0.011 | -0.292 | 0.180 | 0.147 | 0.061 | 0.068 |
| OVX+t−1 | 0.181 | 0.804*** | 0.688** | 0.824*** | 0.488** | 0.508** | 0.300** | 0.772*** |
| OVX−t−1 | -0.105 | -0.288 | -0.169 | 0.161 | -0.270 | 0.143 | 0.087 | 0.029 |
| TBVX+t−1 | 0.369** | 0.783** | 0.430** | 0.637** | 0.346** | 0.352** | 0.596*** | 1.029*** |
| TBVX−t−1 | -0.299** | -0.548** | 0.038 | 0.391 | -0.437 | 0.361 | -0.036 | -0.510** |
| VIX+t−1 | 0.595*** | 1.256*** | 0.373** | 1.155*** | 0.247*** | 0.474** | 0.408** | 0.861*** |
| VIX−t−1 | 0.386** | 0.413 | -0.201 | 0.364 | 0.179 | -0.406 | -0.140 | -0.362 |
| ΔEPUt−2 | -0.330*** | |||||||
| ΔEPUt−3 | 0.193*** | |||||||
| ΔGVZ+t | 0.719*** | 0.725*** | ||||||
| ΔGVZ+t−1 | 0.595** | |||||||
| ΔGVZ+t−4 | 1.007*** | |||||||
| ΔGVZ−t−1 | 0.081 | |||||||
| ΔGVZ−t−5 | 0.535*** | |||||||
| ΔOVX−t−4 | -0.033*** | |||||||
| ΔTBVX+t−1 | 1.503*** | |||||||
| ΔTBVX+t−2 | 2.503*** | |||||||
| ΔTBVX+t−6 | 1.094** | |||||||
| ΔTBVX−t | -0.150 | |||||||
| ΔVIX+t | 0.763*** | 0.611*** | 1.546*** | |||||
| ΔVIX+t−3 | 0.366** | |||||||
| ΔVIX−t−1 | -0.579 | -0.705 | ||||||
| ΔVIX−t−5 | -0.392*** | |||||||
| Panel B Long-run asymmetric effects and diagnostics |
||||||||
| L+GVZ | 0.787*** | 0.410*** | 0.397*** | 0.178*** | 0.167*** | 0.191 | 0.225*** | 0.580*** |
| L−GVZ | -0.720*** | -0.033 | 0.016 | -0.376 | 0.223 | 0.181 | 0.129 | 0.187 |
| WLR(GVZ) | 2.901** | 6.797** | 2.28*** | 2.838** | 4.132** | 1.915** | 0.270* | 1.289*** |
| L+OVX | 0.396 | 1.262*** | 0.993** | 1.060*** | 0.605*** | 0.625** | 0.636*** | 2.121*** |
| L−OVX | -0.237 | -0.452 | -0.244 | 0.207 | -0.335 | 0.176 | 0.185 | 0.080 |
| WLR(OVX) | 1.098*** | 4.340** | 2.066** | 4.044** | 2.245*** | 1.116*** | 1.072*** | 6.247** |
| L+TBVX | 0.807** | 1.229** | 0.620** | 0.820*** | 0.429** | 0.433*** | 1.261*** | 2.827*** |
| L−TBVX | -0.653 | -0.864** | 0.055 | 0.503 | -0.542 | 0.444 | -0.076 | -1.401 |
| WLR(TBVX) | 0.383 | 11.343*** | 1.000 | 3.519** | 3.811** | 0.436 | 4.721** | 1.720 |
| L+VIX | 1.301*** | 1.973*** | 0.538** | 1.486** | 0.307*** | 0.582** | 0.863** | 2.365*** |
| L−VIX | 0.843¬** | 0.649 | -0.290 | 0.469 | 0.222 | -0.499 | -0.297 | -0.995 |
| WLR(VIX) | 1.336** | 6.950** | 6.774*** | 11.659*** | 4.119*** | 13.046*** | 6.766*** | 5.892** |
| Adj. R2 | 0.454 | 0.485 | 0.467 | 0.476 | 0.472 | 0.468 | 0.259 | 0.709 |
| Normality | 3.469*** | 6.661*** | 3.264*** | 2.404*** | 2.565*** | 5.335*** | 2.188*** | 4.890*** |
| LM Test | 0.467 | 0.537 | 1.233 | 0.897 | 0.668 | 1.898 | 0.900 | 1.103 |
| HET | 0.415 | 0.216 | 0.151 | 1.848 | 0.518 | 4.293 | 1.572 | 0.382 |
| FF | 2.210 | 0.563 | 0.172 | 2.120 | 0.022 | 0.093 | 0.005 | 0.058 |
| CUSUM | Stable | Stable | Stable | Stable | Stable | Stable | Stable | Stable |
| CUSUMSQ | Stable | Stable | Stable | Stable | Stable | Stable | Stable | Stable |
The findings of estimating NARDL model would work best for adjusting the EPU index are shown in this table. Positive and negative partial sums are indicated by the superscripts + and -, respectively. and defines the estimated long-run coefficients, which are linked to positive and negative variations of the variable x, respectively. The adjusted R2 coefficient of the calculated model is denoted by the value of Adj. R2. The Wald statistic, or WLR, is used to test the null hypothesis that for each explanatory variable in Eq. (7) for the long-run symmetry.
Significance levels: *, **, *** 10%, 5%, 1%.
Asymmetric Dynamic Multipliers
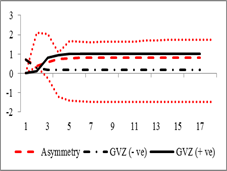
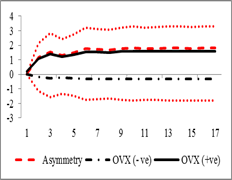
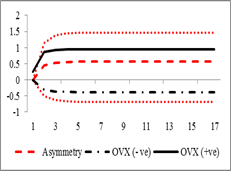
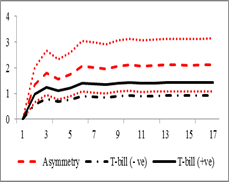
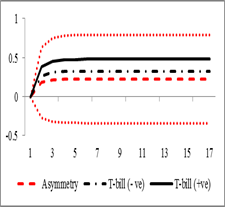
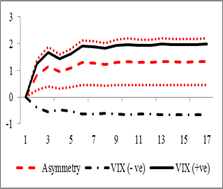
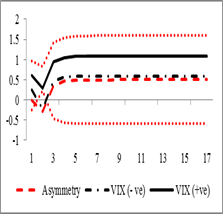
Figure 1 plots the dynamic asymmetric impact of gold price volatility on sample countries. The multipliers correspond to both negative and positive changes represented by the red dashed line. The dotted red line shows the upper and lower bounds of asymmetry. The black line depicts positive shocks and the black dashed line represents negative shocks in gold prices. EPU reacts asymmetrically in both the short-run and long-run to gold price volatility. Shocks to gold prices affect the EPU of all countries in the short-run except Spain. Surprisingly, the EPU of USA reverses when there are negative gold price shocks. Gold price volatility significantly impacts EPU in both positive and negative shocks.
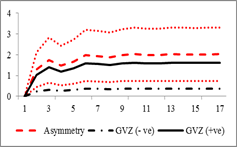
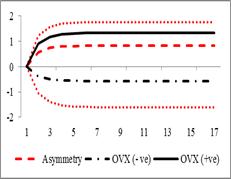
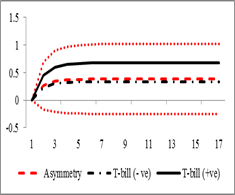
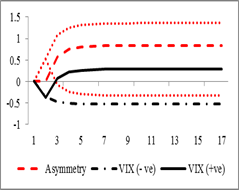
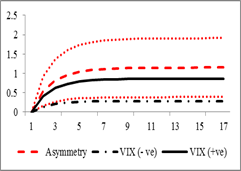
In a similar way, Figure 2 plots the asymmetric dynamic multiplier impact of crude oil price volatility on the EPU of the eight countries. Oli price volatility affect the EPU of all countries (except Canada) in the short-run. While, negative shocks to oil price volatility decrease the EPU of USA. Positive shocks play an important role in predicting the EPU of China, France, Germany, Italy, Spain, and the USA.
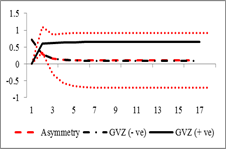
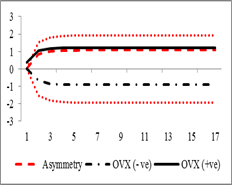
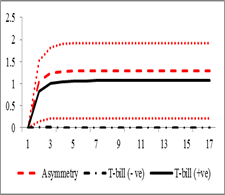
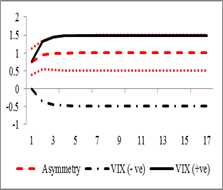
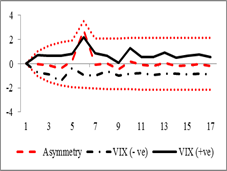
Figure 3 shows the dynamic multiplier of 10-year USA T-Bills volatility on the EPU of sample countries. To predict EPU, T-Bills play an important role. In both the short-run and long-run, positive shocks to T-Bills volatility significantly predict EPU in all countries. While negative shocks adversely act for the EPU of Canada, China, and the USA. Any bad news to these countries badly affects predicting EPU in the long-run.
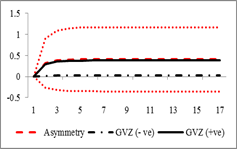
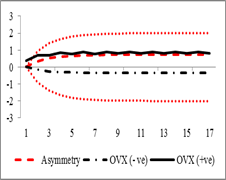
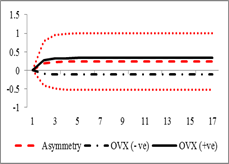
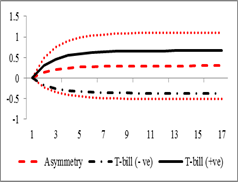
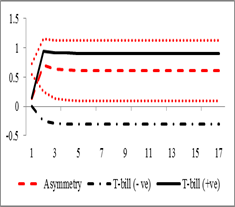
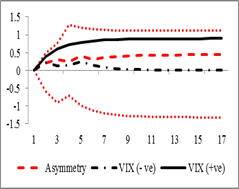
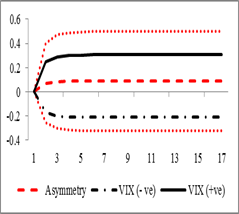
Figure 4 shows the dynamic multiplier effect of implied stock price volatility on the EPU of the eight countries. In both the short-run and long-run, VIX the sentiment index positively affects the EPU of all countries. While, negative shocks to VIX affect all countries in predicting the EPU except for Canada where it performs negatively. In both cases, the intensity of positive shocks to Canada is more pronounced than negative shocks. Investor’s sentiments vary more when there are positive shocks. VIX contributes to predicting the EPU of Germany, Spain, and the USA for a short period. Negative shocks to VIX negatively influence the EPU of the USA with short-term price adjustments. The asymmetric behaviour in the short-run becomes smooth in the long-run.
Figure 1Asymmetric Dynamic Multipliers Gold Price (GVZ) Volatility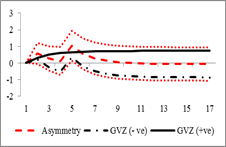
a) France b) Grmany
a) Italy b) Spain

a) UK b) USA
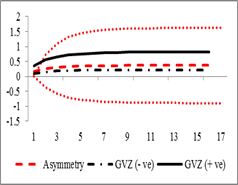
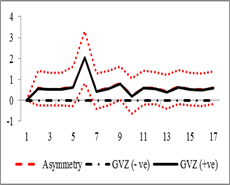
Figure 2Asymmetric Dynamic Multipliers Crude Oil Price (OVX) Volatility
a) France b) Grmany
a) Italy b) Spain
a) UK b) USA
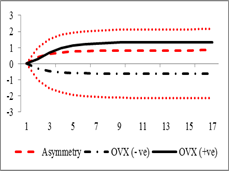
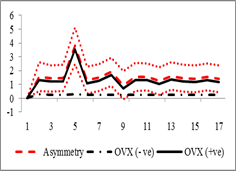
Figure 3Asymmetric Dynamic Multipliers 10-Year USATreasury Bonds Price Volatility
a) France b) Grmany
a) Italy b) Spain
a) UK b) USA
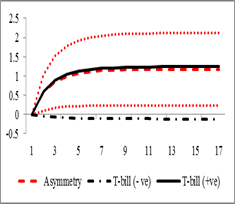
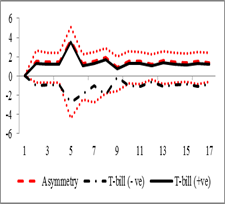
Figure 4Asymmetric Dynamic Multipliers Stock Price Volatility Index (VIX)
a) France b) Grmany
a) Italy b) Spain
a) UK b) USA
Conclusion
Oil price volatility, gold price volatility, T-Bills volatility, and VIX volatility are the four major asset classes for policymakers and investors that have the ability to affect the EPU of the eight selected countries. This study contributes in a nonlinear way by considering the impact of four asset class volatilities to predict EPU which shapes the economic environment. The current study employed the nonlinear ARDL model to determine the short-run and long-run dynamics between EPU and gold price volatility, oil price volatility, US treasury bond volatility, and US implied volatility index. The findings are in line with (Raza et al., 2016). Moreover, these volatilities were selected based on the uncertain results in the EPU of these countries. The result of bounds testing validates the existence of asymmetric behavior in the long-run for all the selected countries. The findings of short-run and long-run nonlinear impact of volatilities indicate the effect of positive and negative shocks considering the European debt crisis and the market crash period of China. It indicates that positive and negative news in four major markets predicts EPU differently. In the short-run, positive shocks affect positively the EPU of all countries for all four asset classes. Although Canada does not bear any effect of positive shocks to gold price, oil price, TVXVIX, and VIX volatilities to predict EPU, while the USA shows the negative impact of negative shocks. T-Bills derived negative shocks adversely affect China (-0.864**) at 5% level of significance. Canada is more pronounced to good news than bad news. The Wald test confirmed the nonlinear asymmetric behaviour between EPU and explanatory variables. Volatility shocks have a different effect on EPU in both the short-run and long-run. The findings clearly support that stable oil, gold, T-Bills, and VIX volatilities in both the short-run and long-run are beneficial to analyze EPU. Moreover, commodity prices can act as a safe haven during positive uncertainty periods. Hence, it is important for policymakers to take into consideration commodity market volatilities. It is an essential element for future EPU which rises with commodity price changes.
CONFLICT OF INTEREST
The authors of the manuscript have no financial or non-financial conflict of interest in the subject matter or materials discussed in this manuscript.
DATA AVAILABILITY STATEMENT
The data associated with this study is available at data Stream Refinitiv. The data associated with this study will be provided by the corresponding author upon request.
FUNDING DETAILS
This research received no external funding.