Moghis Ur Rehman*, Zamrud Khursheed, and Muhammad Kashif Ali
University of Management and Technology, Lahore, Pakistan
* Corresponding Author: [email protected]
This study examines the volatility spillovers and financial connectedness of conventional equity stock markets in developed, emerging, and frontier economies in GCC, SAARC, BRIC, and G7. Diebold and Yilmaz (DY-12) and Barunik and Krehlik (BK-18) spillover methods are used to analyze the daily data for the period 2012-2021. The findings indicate that the coronavirus pandemic significantly affected return and volatilities in conventional stock markets, surpassing any previous economic instability event, such as the 2014-2015 crude oil crisis. The findings also reveal that conventional stock markets are weakly interconnected in terms of overall return, with the US stock market being the top transmitter of returns and volatility. These findings have significant policy implications for investors, regulators, and policymakers.
Keywords: conventional indices, financial connectedness, stock indices return, volatility spillovers
Since the global financial crisis (GFC) of 2008-09 and the European debt crisis (EDC) of 2011-12, the popularity of conventional equities has declined significantly (Bossman, 2021). By measuring both the volatility spillovers and informational efficiency across markets, one can determine the level of performance connected with conventional markets. Additionally, the question that how conventional markets interact with one another during the times of crises is addressed in this study. The results show that the markets do not become more volatile (Ben Rejeb & Arfaoui, 2019).
The total return connectedness index among agricultural commodities and emerging stock indices is 16.2%, indicating that these markets are weakly interconnected. Moreover, the total volatility connectedness index is 18.5%, indicating that these markets are more volatile (Babar et al., 2023).
The majority of the existing studies focus on the impact of developed markets on each other, or on the impact of local and regional markets on each other. This research examines the directional co-movement of volatility and connectedness in a wide range of conventional stock markets encompassing developed, emerging, and frontier markets. It investigates the financial connectedness and volatility spillovers of the conventional equity stock markets. There has been no specific research on these regions in terms of conventional indices. Thus, this research fills the gap created by 18 conventional stock indices in these countries.
Overall, net spillovers between BRIC and G7 markets are expected to be significant in the short-term, with France, Germany, and the United Kingdom transmitting the most shocks to BRIC markets. There is no evidence of sporadic volatility in the studied markets during the coronavirus pandemic at any frequency. The findings reveal that in the short to medium term and medium term to long term), France and the United Kingdom (Canada and the United States) comprise the sources of contagion between the BRIC and G7 markets. According to the net-pairwise spillovers, the BRIC index and its members are highly connected. Indeed, BRIC countries are net-pairwise spillover transmitters to all G7 markets excluding Japan (Agyei et al., 2022).
The global financial markets are likely to respond to the uncertainty caused by the pandemic. Bossman (2021) and Hasan (2020) discuss how the pandemic has affected asset classes. Bossman et al. (2022) argue that conventional financial markets are so interconnected that diversifying one’s portfolio is difficult. So, it's important to look at how different asset classes work together and interact during financial crises (Bossman, 2021).
Keeping in view the limitations of the widely used spillover framework of Diebold and Yilmaz (2012), this study employs time-varying parameter vector autoregression (TVP-VAR) model (Antonakakis & Gabauer, 2017). The current study makes a number of significant contributions. Firstly, it estimates the VAR model. Secondly, the spillover index (Diebold & Yilmaz, 2012) for both return and volatility is calculated using a 100 rolling window size. Third, no observations are lost during the estimation process, as in Diebold and Yilmaz (DY-12) and Barunik and Křehlik (BK-18). Fifthly, the connectedness analysis can be applied to data from different frequency bands. Sixthly, this study visualizes the Diebold and Yilmaz (2012) time domain and Barunik and Křehlik (2018) frequency domain connectedness results.
The impact of the coronavirus pandemic on stock markets worldwide has been substantial, resulting in negative abnormal returns in several countries. This literature review examines studies related to stock market indices and their financial connectedness. Specifically, it focuses on the Gulf Cooperation Council (GCC), South Asian Association for Regional Cooperation (SAARC), BRIC, and G7 stock markets. This review provides insights into the dynamic relationships among these markets by analyzing the existing research on volatility spillovers and interconnectedness.
A strong relationship is demonstrated between G7 stock market returns, volatility, and the macroeconomic factors using the spillover index approach and a generalized VAR framework. Notably, the mechanisms of spillover transmission and reception between these markets and macroeconomic fundamentals have changed dramatically following the 2007-08 global financial crisis, revealing altered interdependencies (Abbas et al., 2020).
Volatility spillovers among global stock markets have been studied using various models. Zhang et al. (2020) used the BEKK-GARCH model to examine volatility associations and to construct dynamic networks, revealing significant spillovers in G20 equity markets. Panda et al. (2021) analyzed stock indices for 16 BRICS countries using the volatility spillover index, while identifying countries as net senders and net receivers of volatility.
Various studies have explored the impact of volatility spillovers on risk management. Most recently, Agyei et al. (2022) used Barunik and Křehlik spillover index to analyze time-frequency spillovers between BRIC and G7 equity markets. Using a TVP-VAR model, this study reveals a strong interdependence among Eurozone equity markets, with core countries serving as major shock transmitters and new countries being more vulnerable to shocks. The findings highlight the importance of investors closely monitoring developed markets and policymakers strengthening equity market resilience in order to sustain economic growth (Umar et al., 2023)
The current paper analyzes information transmission in regional energy markets using the Diebold and Yilmaz (2012) and Barunik and Křehlik (2018) models. The study determines that developed regions are net transmitters of spillovers, whereas developing regions are net receivers. It also emphasizes the relevance of policy changes, diverse investment strategies, and regulatory measures in navigating economic crises, which benefits policymakers, investors, and financial institutions (Alawi et al., 2023).
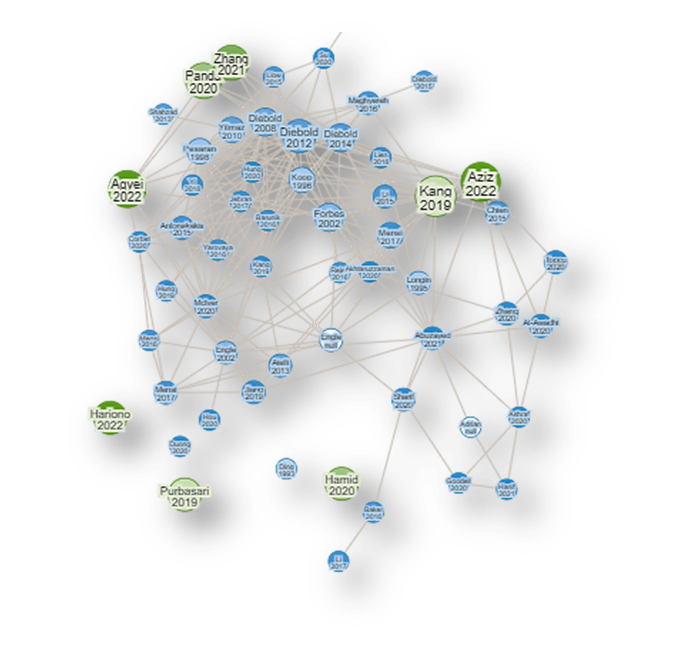
Figure 1
Literature Visualization
Note. Figure 1 Depicts Literature Visualization of Similar Economic Literature, Although with Different Methods and Techniques (ResearchRabbit).
Data and Variables
The analysis uses stock indices from GCC, BRIC, SAARC, and G7 equity markets. The data is collected from Thomson Reuters DataStream and investing.com. RStudio software is used for Diebold and Yilmaz (2012) as well as Barunik and Křehlik (2018) estimation. The results are visualized in Gephi 0.90 software. It estimates spillovers and analyzes connections using logarithm returns and volatility. The analysis covers various events, including oil price crises, economic crises, and the COVID-19 pandemic.
Table 1 displays the return series for conventional stocks, with positive average returns, except for Oman. Non-normal distributions are observed with a non-probability of 0.00 for all series and 0.00 for both. Stationarity variables remain stable at the ADF level. In financial markets, dynamic returns refer to the changing or evolving patterns of investment performance over time. Dynamic volatility, on the other hand, assesses the degree of price volatility or market volatility over a given time period. Fig. 1 illustrates similar studies, although the methodologies, techniques, and variables vary from study to study but these remain interrelated. Green nodes indicate that these studies are referenced in this study, while blue nodes indicate that this study’s citations are linked to other economic literature. Fig. 2 shows the daily closing prices of conventional stocks and yellow highlight shows the crises. Fig. 3 shows the log returns of conventional stocks and yellow highlight shows the crises. Fig. 4 shows the log volatilities of conventional stocks and yellow highlight shows the crises. Fig. 5 shows a non-homogeneous analysis of conventional asset prices, with at least 1% positive, negative, or none correlations.
Figure 2.
Time Series Plot for Conventional Stocks
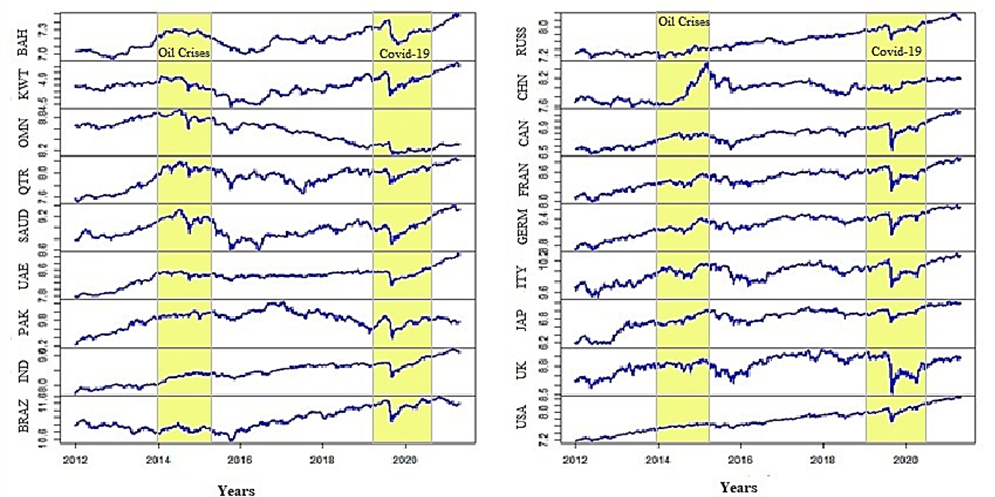
Note. Figure 2 describes market prices for the GCC, SAARC, BRIC, and G7 financial markets of conventional stocks (RStudio).
Figure 3
Dynamics for Conventional Stocks Returns
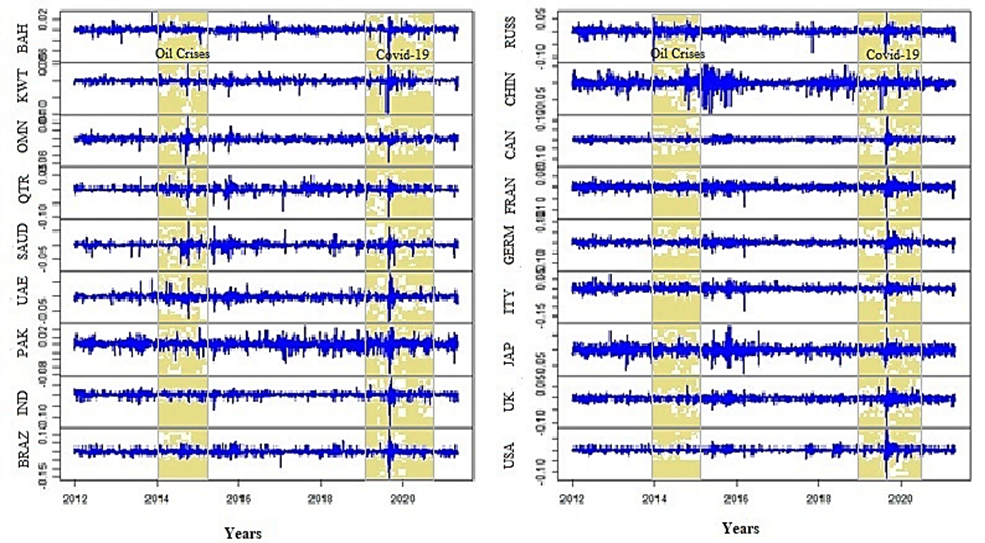
Note. Figure 3 describes market returns for the GCC, SAARC, BRIC, and G7 financial markets of conventional stocks (RStudio).
Figure 4
Dynamics for Conventional Stocks Volatility
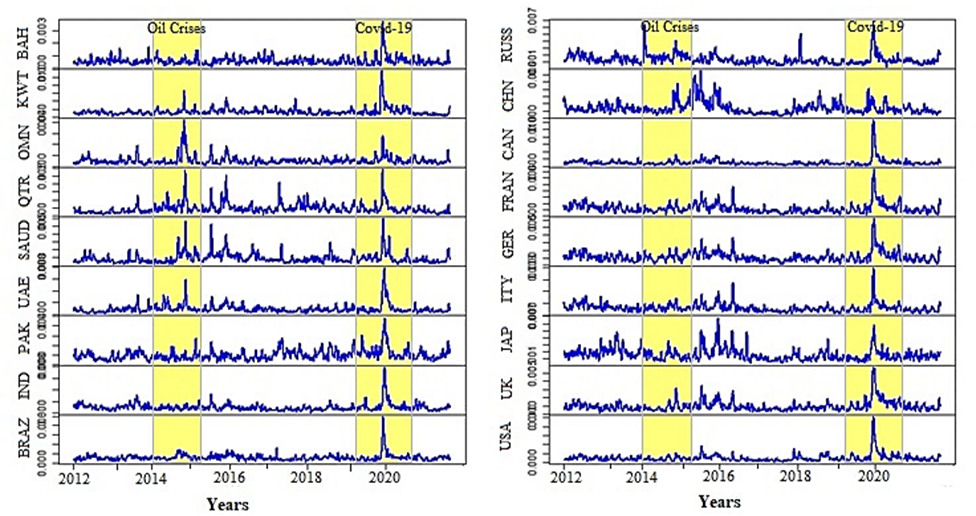
Note. Figure 4 describes market volatility for the financial markets of GCC, SAARC, BRIC, and G7 of conventional stocks (RStudio).
Table 1
Descriptive Statistics of Conventional Stock Market Indices
|
|
Mean |
Median |
Maximum |
Minimum |
Std. Dev |
Skewness |
Kurtosis |
Jarque-B |
ADF |
|
Bahrain |
0.00018 |
0.000133 |
0.033828 |
-0.06001 |
0.004945 |
-1.08488 |
18.475 |
24663.6* |
-30.493* |
|
Kuwait |
0.00013 |
0.000294 |
0.049855 |
-0.09798 |
0.008247 |
-2.15762 |
29.715 |
73963.7* |
-32.748* |
|
Oman |
-0.00014 |
-0.00004 |
0.053696 |
-0.06413 |
0.00606 |
-1.07694 |
20.414 |
31098* |
-28.712* |
|
Qatar |
0.00026 |
0.000314 |
0.072725 |
-0.09998 |
0.00952 |
-0.80416 |
16.725 |
19288.1* |
-33.977* |
|
Saudia |
0.00023 |
0.000822 |
0.085475 |
-0.08685 |
0.010865 |
-0.97195 |
14.628 |
14038.7* |
-33.557* |
|
UAE |
0.00051 |
0.00056 |
0.080762 |
-0.08406 |
0.010382 |
-0.17654 |
16.055 |
17227.2* |
-34.123* |
|
Pakistan |
0.00021 |
0.000090 |
0.050398 |
-0.0778 |
0.011566 |
-0.44232 |
7.3443 |
1985.2* |
-33.253* |
|
India |
0.00056 |
0.001071 |
0.078009 |
-0.13744 |
0.010754 |
-1.31726 |
20.262 |
30797.9* |
-34.240* |
|
Brazil |
0.00024 |
0.000304 |
0.130228 |
-0.15994 |
0.016199 |
-0.82393 |
15.450 |
15930.5* |
-35.192* |
|
Russia |
0.00037 |
0.000426 |
0.074349 |
-0.11419 |
0.011683 |
-0.77874 |
12.289 |
8959.8* |
-35.197* |
|
China |
0.00021 |
0.000569 |
0.056036 |
-0.08873 |
0.013348 |
-0.96111 |
10.201 |
5610.7* |
-34.906* |
|
Canada |
0.00024 |
0.000683 |
0.116801 |
-0.13365 |
0.009576 |
-1.48232 |
49.231 |
216755.8* |
-35.429* |
|
France |
0.0003 |
0.000772 |
0.080561 |
-0.13098 |
0.012167 |
-0.84325 |
13.439 |
11293.7* |
-34.024* |
|
Germany |
0.00039 |
0.000883 |
0.104143 |
-0.13055 |
0.012234 |
-0.65353 |
13.145 |
10568.4* |
-33.839* |
|
Italy |
0.00024 |
0.000867 |
0.079994 |
-0.1791 |
0.014466 |
-1.24664 |
18.088 |
23622.8* |
-34.127* |
|
Japan |
0.00041 |
0.000492 |
0.081345 |
-0.0782 |
0.012454 |
-0.15833 |
7.4635 |
2022.3* |
-32.589* |
|
UK |
0.00009 |
0.000469 |
0.086668 |
-0.11512 |
0.010079 |
-0.70892 |
16.266 |
17978.7* |
-35.757* |
|
USA |
0.00053 |
0.000692 |
0.089683 |
-0.12765 |
0.010406 |
-1.03847 |
25.005 |
49344.6* |
-34.784* |
Note. Table 1 presents financial market statistics for GCC, SAARC, BRIC, and G7 in the conventional stock market. It uses Jarque-Bera normality test and ADF stationarity test, with a 1% significance level indicating the rejection of null hypothesis (Eviews).
Figure 5
Conventional Stocks Correlation
Note. Figure 5 depicts the correlation heat map which displays price correlations for the GCC, SAARC, BRIC, and G7 in the conventional stock market. The intensity of shaded boxes indicates the magnitude of correlations, with blue indicating positive and red indicating negative correlations. All correlations are significant at a 1% level (RStudio).
Figure 6
Conventional Stocks Correlation Matrix
Note. Figure 6 depicts correlations matrix for the GCC, SAARC, BRIC, and G7 in the conventional stock market (Microsoft Excel).
Two methods are applied to analyze the volatility spillover and financial connectedness among four different regions' stock indices.-+
1) Diebold and Yilmaz Spillover Index.
2) Barunik and Kehlik Spillover Index
The current study examines risk spillover in stock markets using the connectedness structure DY-12 (Liu et al., 2022) Based on a forecast generalized variance decomposition (FGVD) procedure in vector auto-regression (VAR) models, this approach can not only measure the spillover index in time domain but also detect the risk contagion direction of this spillover index. The method begins with an N-variate covariance stationary generalized VAR framework with lag p:
Rt= ∅1 R(t-1)+ ∅2 R(t-2)+ …. + ∅p R(t-p)+ ϵt I
The ith coefficient matrix "φi" represents stock market volatility, while Rt represents market volatility. White noise, ϵt ∼ N (0, ∑ ϵ , and Rt are stationary covariance procedures with roots outside the unit circle.
Rt= ϵt+ K1 ϵ(t-1)+ K2 ϵ(t-2)+⋯+ K∞ϵ(t-∞) II
The Kh matrix is a recursive N-dimensional unit matrix, measuring forecast error variance Rj on different horizons. The DY method calculates forecast error ratios due to market shocks Rk at the H-horizon. When j ≠ k, the pairwise directional spillover is denoted by (ΞH)j, k..
(ΞH)j, k = (σkk(-1) ∑(h=0)(H=1)(KH Σϵ )j,k)2)/(∑(h=0)(H=1)(KH ∑ϵ KH')j,j) III
The VAR framework uses σkk = (∑)kk as the standard error of the kth equation, Kh as an N × N matrix, and ∑ ε is non-diagonal covariance matrix of VAR error term εt. The standard pairwise spillover from market "k" to "j" is
(Ξ'H)j,k=(ΞH)(j,k)/∑k(ΞH) (j,k) IV
Additionally, the construction of the total volatility spillover index is as follows:
QH=100 (∑(j≠k)(Ξ'H)j,k)/(∑(Ξ'H)(j,k))=100 (1-(Br {(Ξ'H })/N) V
The trace operator, that is, Br {•} calculates the variance in forecast error due to volatility shock spillovers across markets. Market "j" receives directional spillover from the other k markets
Q(H,j←∎) = 100 (∑(k.k≠j)(Ξ'H)j,k)/(Ʃ(Ξ'H)(j,k))=100 (∑(k,k≠j)((Ξ'H)(j,k))/N VI
The directional spillover from the market’s "j" to all other markets’ "k" is similar.
Q(H,∎←j) = 100 (∑(k,k≠j)(Ξ'H)k,j)/(∑(Ξ'H )k,j)=100 (∑(k,k≠j)(Ξ'H)k,j)/N VII
Moreover, the difference between Equations (VI) and (VII) can be quickly determined to establish the net directional spillover of the market "j".
Q(H,j)= Q(H,∎←j)- Q(H,j←∎)
Table 2
Conventional Equity Stock Market Indices
|
Regions |
Index |
Code |
Source |
|
Bahrain |
Bahrain All Share Index |
BAHASI |
Thomson Reuters Eikon |
|
Kuwait |
Kuwait Price Index |
KUWPI |
Thomson Reuters Eikon |
|
Oman |
MSX 30 Index |
MSX30 |
Thomson Reuters Eikon |
|
Qatar |
Qatar All Share Index |
QATAI |
Thomson Reuters Eikon |
|
Saudi Arabia |
Tadawul FF Index |
TASI |
Thomson Reuters Eikon |
|
UAE |
ADX General Index |
ADXG |
Thomson Reuters Eikon |
|
Pakistan |
KSE 30 Index |
KSE30 |
Thomson Reuters Eikon |
|
India |
Nifty 200 Index |
NIFTY200 |
Thomson Reuters Eikon |
|
Brazil |
Bovespa Index |
BVSPI |
Thomson Reuters Eikon |
|
Russia |
MOEX Russia Index |
MOEX |
Thomson Reuters Eikon |
|
China |
Shanghai Comp Index |
SSEC |
Thomson Reuters Eikon |
|
Canada |
S&P/TSX 60 Index |
SPTSE |
Thomson Reuters Eikon |
|
France |
CAC 40 Index |
CAC40 |
Thomson Reuters Eikon |
|
Germany |
DAX Index |
DAX |
Thomson Reuters Eikon |
|
Italy |
Italia All-Share Index |
ITLAI |
Thomson Reuters Eikon |
|
Japan |
Topix 100 Index |
TOPX100 |
Thomson Reuters Eikon |
|
UK |
FTSE 100 Index |
FTSE100 |
Thomson Reuters Eikon |
|
USA |
S&P 500 Index |
SPX |
Thomson Reuters Eikon |
Note. Table 2 shows the countries selected in this study, with index names, codes, and sources of data collection.
Barunik and Křehlik (2018) used the BK-18 (Liu et al., 2022) method to analyze risk spillovers over time horizons, obtaining (f(ϖ)) j,k, representing the ratio of payable shocks in the jth market's spectrum at frequency ϖ.
(f(ϖ))(j,k)=(σkk(-1) K(e(-iϖ))Σ)(j,k)⃒2/(K(e(-iϖ))ΣK' (e(+iϖ))j,j) IX
The jth market's frequency share of variance must be weighted into (f(ϖ))(j,k)to /ensure/ the forecast error variance decomposition for various frequencies. The definition of the weighting function is as follows:
Λ(j)(ϖ)= (K(e(-iϖ))ΣK'(e(+iϖ))(j,j)/(1/2π ∫(-π)π (K(e(-iλ) ΣK'(e(+iλ)j.jdλ) X
The above equation expresses the influence of something at a specific frequency over all other frequencies in the particular frequency band (−π, π). Therefore, the FEVD on the frequency band h = (a, b), a, b ∈ (− π, π) and a < b is
(ΞH)(j,k)=1/2π ∫H Λ(j) (ϖ)(f(ϖ))(j,k)dϖ XI
In the time domain. Eq. (11) can be transformed into when h→ ∞, (Ξ∞)(j,k) In the time domain. Eq. (11) can be transformed into when h→ ∞, (Ξ∞ )(j,k)
(Ξ∞)(j,k)=1/2π ∫(-π)π Λ(j) (ϖ)(f(ϖ))(j,k)dϖ XII
Further standardization of the GFEVD on the frequency bands h = (a, b), a, b ∈ (− π, π) and a < b as follows:
((Ξ) ̃H )(j,k)= ( (ΞH )(j,k))/(∑k((Ξ∞)j,k) XIII
The spillover from the market’s "k" to the market’s "j" is measured inside the frequency band h by ((Ξ) ̃H )(j,k). Following this definition, the frequency spillover caused on the frequency band h is as follows:
BHF=100.(∑ j≠k((Ξ) ̃H)(j,k))/((Ξ) ̃H )(j,k)-(Br((Ξ) ̃H)/((Ξ) ̃H)(j,k)= 100.(1-(Br(Ξ) ̃H)/N) XIV
Similar to how it is done in equations, the directional spillover and net spillover are also computed (VI)-(VIII).
This section gives the results of DY-12 time-domain connectedness and BK-18 frequency-domain connectedness. The investigation of the returns and volatility spillovers between the global conventional stock markets for short-, medium-, and long-term frequencies is presented.
The VAR model calculates return and volatility spillover over time, while the DY-12 methodology uses generalized variance decomposition to build a volatility and spillover table. The spillover table is divided into three frequency bands using the BK-18 frequency domain technique. The dynamic connectivity is evaluated using a 100-day rolling window size and a 100-day forecast horizon, as per Mensi et al. (2023).
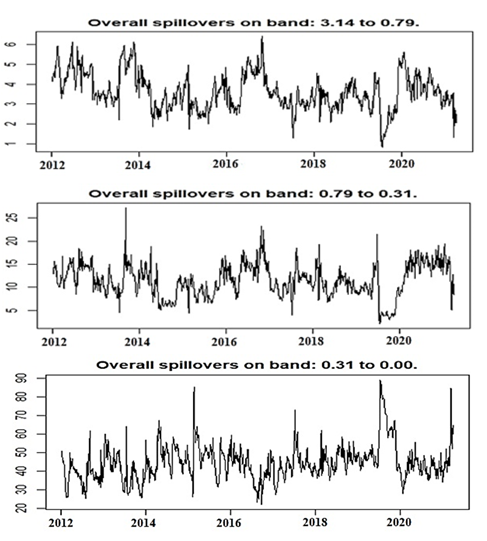
Static connectedness in financial markets refers to the degree and nature of relationships or interdependencies between different stock markets at a specific point in time. Tables 3 and 4 present empirical findings for conventional stocks, while Table A shows DY-12 results and Table B-D show BK-18 estimates. Cross-market spillover effects are illustrated and the total spillover index of other variables is presented. Tables B to D show the total frequency connectedness of three frequency bands. Total interconnectivity of returns is 23.83% and 25.5% for volatility, while frequency connectedness for returns is 14.48%, 5.30%, and 4.05%, and frequency connectedness for volatility is 0.74%, 1.76%, and 22.9%. Return spillovers have short-term effects, while volatility spillovers are more pronounced in the long-term.
Table 3 (a)
Diebold–Yilmaz Spillover Method (DY-12)
|
1 |
2 |
3 |
4 |
5 |
6 |
7 |
8 |
9 |
10 |
11 |
12 |
13 |
14 |
15 |
16 |
17 |
18 |
FROM |
|
|
1Bahrain |
89.2 |
0.65 |
0.65 |
1.33 |
0.12 |
1.97 |
0.06 |
0.22 |
1.34 |
0.24 |
0.06 |
1.26 |
0.22 |
0.23 |
0.23 |
0.95 |
0.47 |
0.78 |
0.60 |
|
2Kuwait |
0.08 |
94.5 |
0.99 |
0.89 |
0.22 |
0.77 |
0.19 |
0.04 |
0.31 |
0.09 |
0.18 |
0.04 |
0.12 |
0.44 |
0.27 |
0.33 |
0.21 |
0.30 |
0.30 |
|
3Oman |
0.27 |
2.49 |
91.66 |
0.73 |
0.31 |
0.45 |
0.24 |
0.13 |
1.27 |
0.21 |
0.28 |
0.46 |
0.09 |
0.03 |
0.09 |
0.45 |
0.25 |
0.58 |
0.46 |
|
4Qatar |
0.19 |
1.07 |
0.93 |
88.63 |
1.47 |
0.46 |
0.58 |
0.23 |
1.22 |
1.02 |
0.13 |
0.31 |
0.33 |
0.33 |
0.19 |
1.55 |
0.22 |
1.15 |
0.63 |
|
5Saudia |
1.40 |
0.51 |
1.36 |
3.99 |
81.66 |
1.98 |
0.77 |
0.36 |
1.26 |
0.49 |
0.12 |
1.22 |
0.74 |
0.80 |
0.36 |
0.98 |
0.96 |
1.05 |
1.02 |
|
6UAE |
1.62 |
0.89 |
0.72 |
6.30 |
1.68 |
78.01 |
0.44 |
0.29 |
2.08 |
0.66 |
0.20 |
1.30 |
0.91 |
0.82 |
0.96 |
0.62 |
0.62 |
1.86 |
1.22 |
|
7Pakistan |
0.15 |
0.15 |
0.71 |
0.44 |
0.86 |
0.70 |
88.9 |
0.62 |
1.58 |
0.66 |
0.17 |
0.52 |
0.18 |
0.65 |
0.37 |
0.34 |
0.61 |
2.41 |
0.62 |
|
8India |
0.51 |
0.26 |
0.74 |
0.29 |
0.35 |
0.47 |
0.28 |
82.38 |
3.62 |
1.08 |
0.13 |
2.40 |
0.65 |
0.94 |
0.48 |
0.70 |
1.03 |
3.69 |
0.98 |
|
9Brazil |
0.52 |
0.15 |
0.07 |
1.27 |
0.75 |
0.27 |
0.22 |
0.62 |
83.0 |
2.81 |
0.25 |
0.28 |
0.23 |
0.36 |
0.74 |
1.31 |
0.98 |
6.12 |
0.94 |
|
10Russia |
0.07 |
0.21 |
0.11 |
0.44 |
0.25 |
0.34 |
0.25 |
0.68 |
2.22 |
92.55 |
0.33 |
0.43 |
0.15 |
0.17 |
0.06 |
1.36 |
0.08 |
0.30 |
0.41 |
|
11China |
0.02 |
0.46 |
0.17 |
0.11 |
0.16 |
0.07 |
0.04 |
0.03 |
0.15 |
0.25 |
96.9 |
0.09 |
0.06 |
0.11 |
0.10 |
0.65 |
0.29 |
0.30 |
0.17 |
|
12Canada |
1.43 |
0.27 |
0.71 |
1.11 |
0.73 |
0.47 |
0.65 |
1.13 |
10.1 |
2.34 |
0.50 |
47.91 |
0.89 |
1.93 |
0.99 |
1.40 |
1.87 |
25.59 |
2.89 |
|
13France |
0.36 |
0.14 |
0.07 |
0.46 |
0.17 |
0.52 |
0.06 |
0.83 |
3.10 |
1.59 |
0.21 |
2.00 |
41.21 |
16.59 |
19.66 |
0.54 |
6.24 |
6.25 |
3.27 |
|
14Germany |
0.40 |
0.19 |
0.06 |
0.16 |
0.78 |
0.59 |
0.06 |
0.81 |
2.97 |
1.82 |
0.37 |
1.87 |
14.87 |
46.15 |
10.63 |
0.54 |
9.41 |
8.34 |
2.99 |
|
15Italy |
0.22 |
0.27 |
0.19 |
0.31 |
0.13 |
0.54 |
0.05 |
0.55 |
2.25 |
1.14 |
0.25 |
1.78 |
21.96 |
13.07 |
46.45 |
0.49 |
4.60 |
5.74 |
2.97 |
|
16Japan |
0.21 |
1.01 |
0.09 |
0.07 |
0.07 |
0.07 |
0.02 |
0.14 |
0.43 |
1.53 |
1.27 |
0.34 |
0.05 |
0.16 |
0.06 |
94.27 |
0.07 |
0.13 |
0.32 |
|
17UK |
0.74 |
0.13 |
0.07 |
0.27 |
0.42 |
0.38 |
0.19 |
1.57 |
5.73 |
1.97 |
0.25 |
3.93 |
5.27 |
9.85 |
3.57 |
0.94 |
54.01 |
10.70 |
2.56 |
|
18USA |
0.63 |
0.65 |
0.17 |
1.46 |
0.56 |
0.47 |
0.45 |
1.28 |
7.62 |
2.65 |
0.27 |
1.70 |
0.91 |
2.71 |
0.85 |
1.36 |
2.75 |
73.50 |
1.47 |
|
TO |
0.49 |
0.53 |
0.43 |
1.09 |
0.50 |
0.58 |
0.25 |
0.53 |
2.62 |
1.14 |
0.28 |
1.11 |
2.65 |
2.73 |
2.20 |
0.81 |
1.70 |
4.18 |
23.83 |
|
Net |
-0.1 |
0.23 |
-0.03 |
0.46 |
-0.52 |
-0.64 |
-0.37 |
-0.45 |
1.68 |
0.73 |
0.11 |
-1.78 |
-0.62 |
-0.26 |
-0.77 |
0.49 |
-0.86 |
2.71 |
TCI:1.32% |
Note. Table 3(a) displays (DY-12) conventional return spillover from markets in selected regions, calculated by net spillovers (TO) minus FROM and total spillovers index (TCI) by Total FROM/Number of variables.
Table 3(b)
|
1 |
2 |
3 |
4 |
5 |
6 |
7 |
8 |
9 |
10 |
11 |
12 |
13 |
14 |
15 |
16 |
17 |
18 |
FROM_ABS |
FROM_WTH |
|
|
1Bahrain |
60.87 |
0.22 |
0.21 |
0.65 |
0.08 |
1.05 |
0.05 |
0.17 |
0.94 |
0.10 |
0.03 |
0.52 |
0.14 |
0.12 |
0.10 |
0.12 |
0.32 |
0.69 |
0.31 |
0.43 |
|
2Kuwait |
0.06 |
65.43 |
0.51 |
0.39 |
0.12 |
0.59 |
0.16 |
0.02 |
0.20 |
0.08 |
0.08 |
0.04 |
0.08 |
0.42 |
0.13 |
0.24 |
0.20 |
0.26 |
0.20 |
0.28 |
|
3Oman |
0.09 |
0.63 |
53.81 |
0.30 |
0.30 |
0.12 |
0.15 |
0.09 |
0.64 |
0.06 |
0.10 |
0.33 |
0.08 |
0.03 |
0.06 |
0.20 |
0.14 |
0.35 |
0.21 |
0.29 |
|
4Qatar |
0.11 |
0.48 |
0.21 |
64.5 |
0.96 |
0.30 |
0.26 |
0.12 |
0.55 |
0.43 |
0.07 |
0.19 |
0.33 |
0.31 |
0.17 |
0.69 |
0.22 |
0.54 |
0.33 |
0.47 |
|
5Saudia |
0.63 |
0.07 |
0.51 |
1.10 |
58.8 |
1.20 |
0.20 |
0.29 |
0.59 |
0.14 |
0.05 |
0.77 |
0.58 |
0.45 |
0.27 |
0.10 |
0.57 |
0.84 |
0.46 |
0.66 |
|
6UAE |
1.07 |
0.75 |
0.31 |
3.34 |
0.58 |
58.45 |
0.30 |
0.23 |
0.59 |
0.23 |
0.16 |
0.47 |
0.37 |
0.28 |
0.29 |
0.22 |
0.20 |
0.99 |
0.58 |
0.82 |
|
7Pakistan |
0.05 |
0.12 |
0.32 |
0.09 |
0.29 |
0.20 |
62.0 |
0.19 |
0.80 |
0.08 |
0.05 |
0.29 |
0.14 |
0.51 |
0.31 |
0.02 |
0.22 |
2.02 |
0.32 |
0.45 |
|
8India |
0.33 |
0.14 |
0.59 |
0.15 |
0.10 |
0.28 |
0.16 |
62.6 |
1.46 |
0.49 |
0.04 |
1.76 |
0.27 |
0.36 |
0.18 |
0.07 |
0.47 |
2.31 |
0.51 |
0.72 |
|
9Brazil |
0.41 |
0.09 |
0.05 |
1.16 |
0.49 |
0.11 |
0.19 |
0.45 |
65.4 |
1.21 |
0.06 |
0.25 |
0.14 |
0.32 |
0.44 |
0.44 |
0.81 |
5.39 |
0.67 |
0.94 |
|
10Russia |
0.07 |
0.04 |
0.08 |
0.33 |
0.15 |
0.26 |
0.23 |
0.65 |
0.92 |
70.4 |
0.12 |
0.24 |
0.10 |
0.08 |
0.04 |
0.33 |
0.07 |
0.16 |
0.22 |
0.30 |
|
11China |
0.01 |
0.39 |
0.07 |
0.08 |
0.16 |
0.06 |
0.04 |
0.03 |
0.08 |
0.07 |
71.8 |
0.06 |
0.06 |
0.07 |
0.10 |
0.25 |
0.28 |
0.22 |
0.11 |
0.16 |
|
12Canada |
1.19 |
0.17 |
0.59 |
0.62 |
0.32 |
0.25 |
0.58 |
1.03 |
6.43 |
0.68 |
0.19 |
38.90 |
0.63 |
1.43 |
0.66 |
0.34 |
1.20 |
20.17 |
2.03 |
2.87 |
|
13France |
0.26 |
0.08 |
0.04 |
0.37 |
0.03 |
0.40 |
0.05 |
0.55 |
1.27 |
0.49 |
0.07 |
0.77 |
32.7 |
9.89 |
13.76 |
0.15 |
3.05 |
3.07 |
1.90 |
2.70 |
|
14Germany |
0.34 |
0.12 |
0.02 |
0.07 |
0.64 |
0.49 |
0.05 |
0.40 |
1.03 |
0.63 |
0.17 |
0.68 |
11.9 |
36.56 |
8.00 |
0.13 |
5.63 |
4.29 |
1.92 |
2.72 |
|
15Italy |
0.11 |
0.15 |
0.10 |
0.23 |
0.03 |
0.47 |
0.04 |
0.28 |
0.87 |
0.19 |
0.11 |
0.80 |
17.5 |
8.15 |
36.84 |
0.06 |
2.25 |
3.16 |
1.92 |
2.71 |
|
16Japan |
0.18 |
0.48 |
0.08 |
0.06 |
0.04 |
0.05 |
0.01 |
0.09 |
0.21 |
0.65 |
0.51 |
0.21 |
0.05 |
0.07 |
0.05 |
68.7 |
0.07 |
0.12 |
0.16 |
0.23 |
|
17UK |
0.62 |
0.07 |
0.01 |
0.14 |
0.29 |
0.22 |
0.19 |
1.07 |
2.83 |
0.78 |
0.08 |
2.03 |
4.54 |
8.30 |
3.05 |
0.27 |
43.8 |
5.82 |
1.68 |
2.38 |
|
18USA |
0.60 |
0.59 |
0.07 |
1.20 |
0.29 |
0.20 |
0.43 |
1.05 |
4.28 |
1.13 |
0.11 |
0.86 |
0.86 |
2.40 |
0.74 |
0.34 |
2.18 |
60.29 |
0.96 |
1.36 |
|
TO_ABS |
0.34 |
0.25 |
0.21 |
0.57 |
0.27 |
0.35 |
0.17 |
0.37 |
1.32 |
0.41 |
0.11 |
0.57 |
2.10 |
1.84 |
1.57 |
0.22 |
0.99 |
2.80 |
14.48 |
|
|
TO_WTH |
0.48 |
0.36 |
0.30 |
0.81 |
0.38 |
0.49 |
0.24 |
0.53 |
1.86 |
0.58 |
0.16 |
0.81 |
2.97 |
2.61 |
2.23 |
0.31 |
1.41 |
3.96 |
20.48 |
|
|
NET |
0.03 |
0.05 |
0.00 |
0.24 |
-0.19 |
-0.23 |
-0.15 |
-0.1 |
0.65 |
0.19 |
0.00 |
-1.46 |
0.20 |
-0.08 |
-0.35 |
0.06 |
-0.7 |
1.84 |
Barunik–Krehlik Spillover Method (BK-18)—Spillover Band: 3.14–0.79; corresponds to 1 day to 4 days (Short-term)
Note. Table 3(b) displays (BK-18) short-term conventional return spillover from markets in selected regions, calculated by net spillovers (TO-ABS) minus (FROM-ABS).
Table 3 (c)
|
1 |
2 |
3 |
4 |
5 |
6 |
7 |
8 |
9 |
10 |
11 |
12 |
13 |
14 |
15 |
16 |
17 |
18 |
FROM_ABS |
FROM_WTH |
|
|
1Bahrain |
17.00 |
0.19 |
0.21 |
0.38 |
0.02 |
0.52 |
0.00 |
0.03 |
0.24 |
0.06 |
0.01 |
0.43 |
0.05 |
0.06 |
0.07 |
0.36 |
0.08 |
0.07 |
0.16 |
0.87 |
|
2Kuwait |
0.01 |
18.1 |
0.29 |
0.31 |
0.06 |
0.12 |
0.02 |
0.01 |
0.07 |
0.01 |
0.06 |
0.00 |
0.02 |
0.01 |
0.08 |
0.06 |
0.01 |
0.03 |
0.07 |
0.37 |
|
3Oman |
0.10 |
0.99 |
22.8 |
0.22 |
0.01 |
0.18 |
0.05 |
0.02 |
0.33 |
0.08 |
0.09 |
0.07 |
0.01 |
0.00 |
0.02 |
0.14 |
0.06 |
0.12 |
0.14 |
0.78 |
|
4Qatar |
0.05 |
0.28 |
0.38 |
15.2 |
0.29 |
0.10 |
0.20 |
0.06 |
0.32 |
0.33 |
0.05 |
0.07 |
0.00 |
0.02 |
0.01 |
0.49 |
0.00 |
0.35 |
0.17 |
0.94 |
|
5Saudia |
0.44 |
0.19 |
0.47 |
1.62 |
14.3 |
0.46 |
0.32 |
0.02 |
0.30 |
0.17 |
0.02 |
0.27 |
0.10 |
0.22 |
0.05 |
0.40 |
0.23 |
0.11 |
0.30 |
1.69 |
|
6UAE |
0.26 |
0.04 |
0.17 |
1.67 |
0.57 |
12.2 |
0.07 |
0.04 |
0.72 |
0.20 |
0.01 |
0.46 |
0.32 |
0.33 |
0.37 |
0.19 |
0.23 |
0.49 |
0.34 |
1.92 |
|
7Pakistan |
0.04 |
0.02 |
0.20 |
0.16 |
0.28 |
0.26 |
17.0 |
0.22 |
0.40 |
0.24 |
0.05 |
0.14 |
0.03 |
0.09 |
0.04 |
0.13 |
0.22 |
0.26 |
0.16 |
0.88 |
|
8India |
0.10 |
0.05 |
0.07 |
0.05 |
0.11 |
0.10 |
0.06 |
12.4 |
1.07 |
0.23 |
0.04 |
0.40 |
0.22 |
0.35 |
0.16 |
0.26 |
0.31 |
0.73 |
0.24 |
1.35 |
|
9Brazil |
0.07 |
0.04 |
0.02 |
0.04 |
0.13 |
0.10 |
0.02 |
0.09 |
10.7 |
0.87 |
0.10 |
0.02 |
0.05 |
0.02 |
0.17 |
0.43 |
0.10 |
0.40 |
0.15 |
0.84 |
|
10Russia |
0.00 |
0.09 |
0.02 |
0.07 |
0.06 |
0.05 |
0.01 |
0.01 |
0.78 |
13.9 |
0.11 |
0.13 |
0.02 |
0.05 |
0.02 |
0.56 |
0.01 |
0.09 |
0.12 |
0.66 |
|
11China |
0.00 |
0.04 |
0.06 |
0.02 |
0.00 |
0.00 |
0.00 |
0.00 |
0.03 |
0.10 |
16.0 |
0.02 |
0.00 |
0.03 |
0.00 |
0.22 |
0.01 |
0.06 |
0.03 |
0.19 |
|
12Canada |
0.12 |
0.05 |
0.04 |
0.22 |
0.22 |
0.12 |
0.05 |
0.06 |
2.01 |
0.86 |
0.15 |
5.50 |
0.16 |
0.32 |
0.18 |
0.53 |
0.39 |
3.28 |
0.49 |
2.75 |
|
13France |
0.04 |
0.04 |
0.02 |
0.05 |
0.06 |
0.05 |
0.01 |
0.14 |
0.94 |
0.59 |
0.07 |
0.69 |
5.53 |
4.33 |
3.69 |
0.18 |
1.94 |
1.85 |
0.82 |
4.61 |
|
14Germany |
0.02 |
0.05 |
0.02 |
0.04 |
0.05 |
0.04 |
0.01 |
0.22 |
1.01 |
0.64 |
0.11 |
0.68 |
1.89 |
6.26 |
1.63 |
0.22 |
2.34 |
2.35 |
0.63 |
3.55 |
|
15Italy |
0.05 |
0.06 |
0.05 |
0.04 |
0.04 |
0.03 |
0.01 |
0.15 |
0.67 |
0.48 |
0.08 |
0.55 |
2.91 |
3.20 |
6.14 |
0.20 |
1.43 |
1.51 |
0.64 |
3.59 |
|
16Japan |
0.03 |
0.32 |
0.01 |
0.00 |
0.02 |
0.01 |
0.01 |
0.03 |
0.15 |
0.55 |
0.44 |
0.07 |
0.00 |
0.05 |
0.01 |
15.95 |
0.00 |
0.01 |
0.10 |
0.54 |
|
17UK |
0.05 |
0.05 |
0.03 |
0.05 |
0.05 |
0.07 |
0.00 |
0.27 |
1.54 |
0.65 |
0.08 |
1.14 |
0.47 |
1.03 |
0.30 |
0.32 |
6.54 |
2.91 |
0.50 |
2.83 |
|
18USA |
0.01 |
0.04 |
0.05 |
0.11 |
0.14 |
0.16 |
0.02 |
0.12 |
1.77 |
0.82 |
0.08 |
0.50 |
0.03 |
0.21 |
0.05 |
0.51 |
0.34 |
8.16 |
0.27 |
1.55 |
|
TO_ABS |
0.08 |
0.14 |
0.12 |
0.28 |
0.12 |
0.13 |
0.05 |
0.08 |
0.69 |
0.38 |
0.09 |
0.31 |
0.35 |
0.57 |
0.38 |
0.29 |
0.43 |
0.81 |
5.30 |
|
|
TO_WTH |
0.44 |
0.80 |
0.66 |
1.59 |
0.66 |
0.75 |
0.27 |
0.47 |
3.87 |
2.16 |
0.48 |
1.77 |
1.97 |
3.24 |
2.15 |
1.63 |
2.41 |
4.58 |
29.89 |
|
|
NET |
-0.08 |
0.07 |
-0.02 |
0.11 |
-0.2 |
-0.2 |
-0.1 |
-0.2 |
0.54 |
0.26 |
0.06 |
-0.2 |
-0.5 |
-0.1 |
-0.3 |
0.19 |
-0.1 |
0.54 |
Barunik–Krehlik Spillover Method (BK-18)—Spillover band: 0.79–0.31; corresponds to 4 days to 10 days (Medium-term)
Note. Table 3(c) displays (BK-18) medium-term conventional return spillover from markets in selected regions, calculated by net spillovers (TO-ABS) minus (FROM-ABS).
Table 3 (d)
Barunik–Krehlik Spillover Method (BK-18)—Spillover Band: 0.31–0.00; corresponds to 10 days to infinite days (Long- term)
|
1 |
2 |
3 |
4 |
5 |
6 |
7 |
8 |
9 |
10 |
11 |
12 |
13 |
14 |
15 |
16 |
17 |
18 |
FROM_ABS |
FROM_WTH |
|
|
1Bahrain |
11.36 |
0.23 |
0.22 |
0.29 |
0.02 |
0.40 |
0.01 |
0.02 |
0.16 |
0.08 |
0.02 |
0.31 |
0.04 |
0.05 |
0.06 |
0.46 |
0.07 |
0.02 |
0.14 |
1.19 |
|
2Kuwait |
0.00 |
10.98 |
0.19 |
0.19 |
0.04 |
0.06 |
0.01 |
0.01 |
0.04 |
0.01 |
0.05 |
0.00 |
0.02 |
0.01 |
0.06 |
0.03 |
0.00 |
0.01 |
0.04 |
0.35 |
|
3Oman |
0.07 |
0.87 |
15.00 |
0.20 |
0.00 |
0.15 |
0.03 |
0.02 |
0.29 |
0.07 |
0.09 |
0.06 |
0.00 |
0.00 |
0.01 |
0.11 |
0.05 |
0.11 |
0.12 |
1.03 |
|
4Qatar |
0.03 |
0.31 |
0.34 |
8.93 |
0.22 |
0.06 |
0.12 |
0.05 |
0.34 |
0.26 |
0.01 |
0.05 |
0.00 |
0.00 |
0.00 |
0.37 |
0.00 |
0.26 |
0.13 |
1.16 |
|
5Saudia |
0.34 |
0.25 |
0.39 |
1.27 |
8.50 |
0.32 |
0.25 |
0.04 |
0.37 |
0.18 |
0.05 |
0.17 |
0.06 |
0.13 |
0.04 |
0.48 |
0.16 |
0.11 |
0.25 |
2.20 |
|
6UAE |
0.30 |
0.10 |
0.24 |
1.29 |
0.53 |
7.35 |
0.07 |
0.01 |
0.78 |
0.22 |
0.03 |
0.38 |
0.22 |
0.21 |
0.30 |
0.22 |
0.19 |
0.38 |
0.30 |
2.63 |
|
7Pakistan |
0.05 |
0.01 |
0.20 |
0.19 |
0.29 |
0.23 |
9.90 |
0.20 |
0.39 |
0.34 |
0.07 |
0.10 |
0.01 |
0.04 |
0.02 |
0.18 |
0.17 |
0.12 |
0.14 |
1.25 |
|
8India |
0.08 |
0.07 |
0.08 |
0.08 |
0.14 |
0.09 |
0.05 |
7.41 |
1.09 |
0.35 |
0.04 |
0.24 |
0.16 |
0.23 |
0.14 |
0.37 |
0.26 |
0.65 |
0.23 |
1.99 |
|
9Brazil |
0.05 |
0.02 |
0.00 |
0.07 |
0.13 |
0.06 |
0.01 |
0.07 |
6.87 |
0.73 |
0.10 |
0.01 |
0.04 |
0.02 |
0.12 |
0.44 |
0.08 |
0.33 |
0.13 |
1.10 |
|
10Russia |
0.00 |
0.08 |
0.01 |
0.03 |
0.04 |
0.03 |
0.00 |
0.01 |
0.52 |
8.30 |
0.10 |
0.06 |
0.02 |
0.04 |
0.01 |
0.46 |
0.00 |
0.05 |
0.08 |
0.71 |
|
11China |
0.00 |
0.03 |
0.04 |
0.00 |
0.00 |
0.00 |
0.00 |
0.00 |
0.03 |
0.08 |
9.17 |
0.01 |
0.00 |
0.02 |
0.00 |
0.18 |
0.00 |
0.03 |
0.02 |
0.21 |
|
12Canada |
0.12 |
0.05 |
0.07 |
0.28 |
0.19 |
0.10 |
0.02 |
0.04 |
1.63 |
0.80 |
0.16 |
3.51 |
0.11 |
0.17 |
0.15 |
0.53 |
0.27 |
2.14 |
0.38 |
3.29 |
|
13France |
0.06 |
0.03 |
0.01 |
0.04 |
0.07 |
0.06 |
0.00 |
0.14 |
0.89 |
0.51 |
0.07 |
0.54 |
3.03 |
2.37 |
2.21 |
0.21 |
1.25 |
1.33 |
0.54 |
4.70 |
|
14Germany |
0.04 |
0.02 |
0.02 |
0.05 |
0.09 |
0.06 |
0.00 |
0.19 |
0.93 |
0.54 |
0.08 |
0.51 |
1.04 |
3.33 |
1.00 |
0.20 |
1.44 |
1.70 |
0.44 |
3.80 |
|
15Italy |
0.06 |
0.05 |
0.04 |
0.04 |
0.06 |
0.04 |
0.00 |
0.13 |
0.71 |
0.47 |
0.06 |
0.42 |
1.58 |
1.72 |
3.47 |
0.23 |
0.91 |
1.08 |
0.42 |
3.64 |
|
16Japan |
0.00 |
0.21 |
0.00 |
0.00 |
0.01 |
0.00 |
0.01 |
0.02 |
0.08 |
0.33 |
0.32 |
0.05 |
0.00 |
0.03 |
0.00 |
9.63 |
0.00 |
0.00 |
0.06 |
0.51 |
|
17UK |
0.07 |
0.02 |
0.03 |
0.07 |
0.08 |
0.09 |
0.00 |
0.23 |
1.36 |
0.54 |
0.09 |
0.77 |
0.26 |
0.52 |
0.22 |
0.36 |
3.69 |
1.97 |
0.37 |
3.21 |
|
18USA |
0.01 |
0.02 |
0.05 |
0.15 |
0.14 |
0.11 |
0.01 |
0.11 |
1.58 |
0.71 |
0.07 |
0.35 |
0.02 |
0.10 |
0.06 |
0.51 |
0.23 |
5.06 |
0.24 |
2.03 |
|
TO_ABS |
0.07 |
0.13 |
0.11 |
0.24 |
0.11 |
0.10 |
0.03 |
0.07 |
0.62 |
0.35 |
0.08 |
0.22 |
0.20 |
0.32 |
0.24 |
0.30 |
0.28 |
0.57 |
4.05 |
|
|
TO_WTH |
0.61 |
1.14 |
0.93 |
2.04 |
0.99 |
0.90 |
0.29 |
0.62 |
5.37 |
2.99 |
0.68 |
1.94 |
1.72 |
2.72 |
2.11 |
2.56 |
2.44 |
4.94 |
34.98 |
|
|
NET |
-0.07 |
0.09 |
-0.01 |
0.11 |
-0.14 |
-0.20 |
-0.11 |
-0.16 |
0.49 |
0.27 |
0.06 |
-0.16 |
-0.34 |
-0.12 |
-0.18 |
0.24 |
-0.09 |
0.33 |
Note. Table 3(d) displays (BK-18) long-term conventional return spillover from markets in selected regions, calculated by net spillovers (TO-ABS) minus (FROM-ABS).
Table 4 (a)
Diebold–Yilmaz Spillover Method (DY-12)
|
1 |
2 |
3 |
4 |
5 |
6 |
7 |
8 |
9 |
10 |
11 |
12 |
13 |
14 |
15 |
16 |
17 |
18 |
FROM |
|
|
1Bahrain |
93.37 |
3.74 |
0.40 |
0.18 |
0.18 |
0.38 |
0.01 |
0.33 |
0.14 |
0.02 |
0.02 |
0.15 |
0.06 |
0.19 |
0.40 |
0.26 |
0.15 |
0.02 |
0.37 |
|
2Kuwait |
0.16 |
92.94 |
1.01 |
1.53 |
0.63 |
0.05 |
0.04 |
0.07 |
0.51 |
0.57 |
0.07 |
0.11 |
0.47 |
0.21 |
0.52 |
0.01 |
0.60 |
0.49 |
0.39 |
|
3Oman |
0.32 |
0.83 |
93.40 |
1.54 |
1.29 |
0.17 |
0.22 |
0.04 |
0.54 |
0.32 |
0.01 |
0.04 |
0.25 |
0.13 |
0.21 |
0.17 |
0.33 |
0.17 |
0.37 |
|
4Qatar |
0.10 |
2.25 |
0.80 |
93.48 |
0.50 |
0.46 |
0.38 |
0.30 |
0.44 |
0.34 |
0.00 |
0.18 |
0.00 |
0.03 |
0.07 |
0.00 |
0.17 |
0.49 |
0.36 |
|
5Saudia |
0.14 |
3.94 |
1.28 |
8.48 |
79.95 |
0.71 |
0.20 |
0.65 |
0.88 |
0.59 |
0.09 |
0.19 |
0.17 |
0.41 |
0.51 |
0.36 |
0.83 |
0.62 |
1.11 |
|
6UAE |
0.43 |
2.51 |
0.76 |
11.49 |
1.00 |
77.19 |
0.07 |
0.12 |
0.31 |
2.12 |
0.34 |
0.58 |
0.45 |
0.53 |
0.74 |
0.65 |
0.41 |
0.31 |
1.27 |
|
7Pakistan |
0.03 |
0.11 |
0.29 |
2.80 |
0.65 |
0.06 |
94.99 |
0.66 |
0.04 |
0.03 |
0.02 |
0.04 |
0.02 |
0.02 |
0.00 |
0.04 |
0.11 |
0.09 |
0.28 |
|
8India |
0.46 |
0.29 |
0.46 |
0.63 |
0.68 |
0.56 |
0.44 |
82.68 |
0.95 |
0.71 |
0.90 |
1.61 |
0.32 |
0.31 |
0.54 |
5.51 |
0.67 |
2.29 |
0.96 |
|
9Brazil |
0.14 |
1.04 |
0.87 |
1.12 |
1.00 |
0.17 |
0.01 |
0.43 |
78.65 |
3.14 |
1.10 |
1.15 |
1.03 |
0.45 |
0.80 |
4.90 |
2.51 |
1.50 |
1.19 |
|
10Russia |
0.08 |
0.58 |
0.25 |
0.16 |
0.28 |
0.72 |
0.00 |
0.09 |
1.06 |
89.41 |
0.77 |
1.06 |
0.60 |
0.38 |
0.32 |
2.60 |
0.88 |
0.75 |
0.59 |
|
11China |
0.03 |
0.16 |
0.01 |
0.05 |
0.56 |
0.01 |
0.09 |
0.21 |
0.10 |
0.21 |
96.40 |
0.15 |
0.38 |
0.58 |
0.16 |
0.57 |
0.25 |
0.07 |
0.20 |
|
12Canada |
0.18 |
1.70 |
0.20 |
0.78 |
0.90 |
0.58 |
0.01 |
0.81 |
3.91 |
2.50 |
1.57 |
52.32 |
1.32 |
1.21 |
1.74 |
11.53 |
3.00 |
15.74 |
2.65 |
|
13France |
0.09 |
0.76 |
0.16 |
0.05 |
0.34 |
0.38 |
0.01 |
0.45 |
1.80 |
2.02 |
1.47 |
4.55 |
28.25 |
15.48 |
13.12 |
6.11 |
13.86 |
11.13 |
3.99 |
|
14Germany |
0.12 |
0.72 |
0.14 |
0.26 |
0.43 |
0.40 |
0.01 |
0.46 |
1.65 |
2.61 |
1.87 |
3.71 |
9.47 |
37.88 |
6.81 |
6.87 |
13.14 |
13.45 |
3.45 |
|
15Italy |
0.19 |
0.69 |
0.17 |
0.20 |
0.39 |
0.51 |
0.00 |
0.45 |
1.43 |
2.92 |
1.02 |
3.64 |
13.74 |
10.04 |
43.21 |
5.82 |
8.05 |
7.53 |
3.15 |
|
16Japan |
0.23 |
0.09 |
0.11 |
0.01 |
0.15 |
0.13 |
0.00 |
0.38 |
0.90 |
0.38 |
1.76 |
0.81 |
0.39 |
0.89 |
1.31 |
91.03 |
0.62 |
0.80 |
0.50 |
|
17UK |
0.10 |
1.63 |
0.21 |
0.48 |
0.65 |
0.28 |
0.03 |
0.61 |
2.64 |
1.23 |
1.75 |
6.36 |
4.43 |
4.77 |
2.99 |
6.77 |
49.30 |
15.77 |
2.82 |
|
18USA |
0.04 |
0.67 |
0.08 |
0.57 |
0.26 |
0.17 |
0.00 |
1.18 |
3.47 |
1.71 |
3.44 |
7.19 |
0.46 |
1.32 |
0.26 |
9.51 |
3.05 |
66.62 |
1.85 |
|
TO |
0.16 |
1.21 |
0.40 |
1.68 |
0.55 |
0.32 |
0.08 |
0.40 |
1.15 |
1.19 |
0.90 |
1.75 |
1.87 |
2.05 |
1.69 |
3.43 |
2.70 |
3.96 |
25.50 |
|
NET |
-0.21 |
1.21 |
0.4 |
1.68 |
0.55 |
0.32 |
0.08 |
0.4 |
1.15 |
1.19 |
0.9 |
1.75 |
1.87 |
2.05 |
1.69 |
3.43 |
2.7 |
3.96 |
TCI:1.41% |
Note. Table 4(a) displays (DY-12) conventional volatility spillover from markets in selected regions, calculated by net spillovers (TO) minus FROM and total spillovers index (TCI) by Total FROM/Number of variables.
Table 4(b)
Barunik–Krehlik Spillover Method (BK-18)—Spillover Band: 3.14–0.79; corresponds to 1 day to 4 days (Short-term)
|
1 |
2 |
3 |
4 |
5 |
6 |
7 |
8 |
9 |
10 |
11 |
12 |
13 |
14 |
15 |
16 |
17 |
18 |
FROM_ABS |
FROM_WTH |
|
|
1Bahrain |
9.91 |
0.01 |
0.03 |
0.01 |
0.01 |
0.04 |
0.00 |
0.04 |
0.01 |
0.00 |
0.00 |
0.01 |
0.00 |
0.01 |
0.03 |
0.02 |
0.01 |
0.00 |
0.01 |
0.18 |
|
2Kuwait |
0.01 |
6.51 |
0.01 |
0.02 |
0.03 |
0.00 |
0.00 |
0.00 |
0.03 |
0.02 |
0.00 |
0.01 |
0.03 |
0.01 |
0.03 |
0.00 |
0.03 |
0.03 |
0.02 |
0.21 |
|
3Oman |
0.02 |
0.01 |
6.87 |
0.01 |
0.02 |
0.01 |
0.01 |
0.00 |
0.03 |
0.02 |
0.00 |
0.00 |
0.01 |
0.01 |
0.01 |
0.01 |
0.01 |
0.00 |
0.01 |
0.14 |
|
4Qatar |
0.00 |
0.02 |
0.01 |
5.78 |
0.02 |
0.03 |
0.02 |
0.02 |
0.02 |
0.01 |
0.00 |
0.01 |
0.00 |
0.00 |
0.00 |
0.00 |
0.01 |
0.03 |
0.01 |
0.16 |
|
5Saudia |
0.01 |
0.02 |
0.02 |
0.02 |
5.92 |
0.04 |
0.01 |
0.03 |
0.00 |
0.01 |
0.00 |
0.00 |
0.00 |
0.02 |
0.02 |
0.01 |
0.03 |
0.00 |
0.01 |
0.18 |
|
6UAE |
0.02 |
0.00 |
0.01 |
0.02 |
0.04 |
5.89 |
0.00 |
0.00 |
0.00 |
0.04 |
0.00 |
0.02 |
0.02 |
0.03 |
0.04 |
0.01 |
0.01 |
0.00 |
0.01 |
0.20 |
|
7Pakistan |
0.00 |
0.01 |
0.01 |
0.03 |
0.01 |
0.00 |
7.60 |
0.04 |
0.00 |
0.00 |
0.00 |
0.00 |
0.00 |
0.00 |
0.00 |
0.00 |
0.00 |
0.00 |
0.01 |
0.08 |
|
8India |
0.03 |
0.00 |
0.00 |
0.02 |
0.04 |
0.00 |
0.04 |
8.35 |
0.02 |
0.00 |
0.01 |
0.02 |
0.01 |
0.00 |
0.02 |
0.02 |
0.02 |
0.02 |
0.02 |
0.23 |
|
9Brazil |
0.01 |
0.03 |
0.03 |
0.03 |
0.00 |
0.00 |
0.00 |
0.02 |
8.58 |
0.06 |
0.00 |
0.07 |
0.07 |
0.01 |
0.04 |
0.06 |
0.14 |
0.07 |
0.04 |
0.50 |
|
10Russia |
0.00 |
0.03 |
0.02 |
0.01 |
0.02 |
0.05 |
0.00 |
0.00 |
0.06 |
7.63 |
0.01 |
0.02 |
0.04 |
0.02 |
0.01 |
0.02 |
0.05 |
0.03 |
0.02 |
0.29 |
|
11China |
0.00 |
0.00 |
0.00 |
0.00 |
0.00 |
0.00 |
0.00 |
0.01 |
0.00 |
0.01 |
6.77 |
0.01 |
0.02 |
0.02 |
0.01 |
0.02 |
0.01 |
0.00 |
0.01 |
0.09 |
|
12Canada |
0.01 |
0.00 |
0.00 |
0.01 |
0.01 |
0.02 |
0.00 |
0.02 |
0.03 |
0.01 |
0.00 |
5.28 |
0.07 |
0.03 |
0.11 |
0.02 |
0.10 |
0.18 |
0.03 |
0.47 |
|
13France |
0.00 |
0.02 |
0.01 |
0.00 |
0.00 |
0.01 |
0.00 |
0.00 |
0.03 |
0.02 |
0.01 |
0.05 |
4.39 |
0.77 |
1.07 |
0.00 |
0.30 |
0.02 |
0.13 |
1.76 |
|
14Germany |
0.01 |
0.01 |
0.00 |
0.00 |
0.01 |
0.02 |
0.00 |
0.00 |
0.01 |
0.01 |
0.02 |
0.02 |
1.03 |
5.14 |
0.75 |
0.02 |
0.34 |
0.06 |
0.13 |
1.77 |
|
15Italy |
0.01 |
0.02 |
0.01 |
0.00 |
0.02 |
0.03 |
0.00 |
0.01 |
0.02 |
0.00 |
0.00 |
0.10 |
1.31 |
0.70 |
5.04 |
0.03 |
0.23 |
0.02 |
0.14 |
1.91 |
|
16Japan |
0.02 |
0.00 |
0.01 |
0.00 |
0.01 |
0.01 |
0.00 |
0.02 |
0.05 |
0.02 |
0.01 |
0.04 |
0.01 |
0.04 |
0.04 |
6.31 |
0.02 |
0.04 |
0.02 |
0.25 |
|
17UK |
0.00 |
0.03 |
0.01 |
0.01 |
0.03 |
0.01 |
0.00 |
0.01 |
0.10 |
0.04 |
0.01 |
0.10 |
0.52 |
0.48 |
0.32 |
0.02 |
6.11 |
0.13 |
0.10 |
1.38 |
|
18USA |
0.00 |
0.02 |
0.00 |
0.02 |
0.00 |
0.00 |
0.00 |
0.01 |
0.04 |
0.02 |
0.00 |
0.20 |
0.02 |
0.08 |
0.02 |
0.02 |
0.14 |
5.32 |
0.03 |
0.46 |
|
TO_ABS |
0.01 |
0.01 |
0.01 |
0.01 |
0.01 |
0.02 |
0.01 |
0.01 |
0.03 |
0.02 |
0.01 |
0.04 |
0.18 |
0.12 |
0.14 |
0.01 |
0.08 |
0.03 |
0.74 |
|
|
TO_WTH |
0.12 |
0.18 |
0.13 |
0.16 |
0.21 |
0.22 |
0.08 |
0.19 |
0.35 |
0.21 |
0.07 |
0.53 |
2.41 |
1.71 |
1.91 |
0.21 |
1.11 |
0.47 |
10.25 |
|
|
NET |
0.00 |
-0.01 |
0.00 |
0.00 |
0.00 |
0.01 |
0.00 |
-0.01 |
-0.01 |
0.00 |
0.00 |
0.01 |
0.05 |
-0.01 |
0.00 |
-0.01 |
-0.02 |
0.00 |
Note. Table 4(b) displays (BK-18) short-term volatility spillover from markets in selected regions, calculated by net spillovers (TO-ABS) minus (FROM-ABS).
Table 4 (c)
Barunik–Krehlik Spillover Method (BK-18)—Spillover Band: 0.79–0.31; corresponds to 4 days to 10 days(Medium-term)
|
1 |
2 |
3 |
4 |
5 |
6 |
7 |
8 |
9 |
10 |
11 |
12 |
13 |
14 |
15 |
16 |
17 |
18 |
FROM_ABS |
FROM_WTH |
|
|
1Bahrain |
17.12 |
0.09 |
0.05 |
0.01 |
0.02 |
0.07 |
0.00 |
0.08 |
0.02 |
0.00 |
0.01 |
0.02 |
0.00 |
0.03 |
0.05 |
0.04 |
0.01 |
0.00 |
0.03 |
0.21 |
|
2Kuwait |
0.02 |
11.79 |
0.03 |
0.05 |
0.06 |
0.00 |
0.01 |
0.01 |
0.05 |
0.04 |
0.01 |
0.01 |
0.05 |
0.02 |
0.06 |
0.00 |
0.06 |
0.05 |
0.03 |
0.22 |
|
3Oman |
0.04 |
0.02 |
12.43 |
0.03 |
0.05 |
0.01 |
0.02 |
0.00 |
0.05 |
0.03 |
0.00 |
0.00 |
0.03 |
0.01 |
0.02 |
0.01 |
0.03 |
0.00 |
0.02 |
0.15 |
|
4Qatar |
0.01 |
0.05 |
0.02 |
10.58 |
0.04 |
0.05 |
0.04 |
0.03 |
0.04 |
0.02 |
0.00 |
0.02 |
0.00 |
0.00 |
0.01 |
0.00 |
0.02 |
0.05 |
0.02 |
0.17 |
|
5Saudia |
0.01 |
0.07 |
0.04 |
0.11 |
10.63 |
0.07 |
0.02 |
0.05 |
0.01 |
0.02 |
0.00 |
0.01 |
0.01 |
0.03 |
0.04 |
0.01 |
0.05 |
0.01 |
0.03 |
0.24 |
|
6UAE |
0.04 |
0.02 |
0.01 |
0.15 |
0.07 |
10.60 |
0.00 |
0.00 |
0.01 |
0.09 |
0.01 |
0.04 |
0.04 |
0.05 |
0.07 |
0.01 |
0.02 |
0.01 |
0.04 |
0.27 |
|
7Pakistan |
0.00 |
0.01 |
0.03 |
0.07 |
0.02 |
0.00 |
13.63 |
0.07 |
0.00 |
0.00 |
0.00 |
0.00 |
0.00 |
0.00 |
0.00 |
0.00 |
0.01 |
0.00 |
0.01 |
0.09 |
|
8India |
0.06 |
0.01 |
0.01 |
0.04 |
0.07 |
0.01 |
0.07 |
14.42 |
0.04 |
0.01 |
0.02 |
0.07 |
0.02 |
0.01 |
0.04 |
0.09 |
0.03 |
0.07 |
0.04 |
0.28 |
|
9Brazil |
0.01 |
0.06 |
0.06 |
0.05 |
0.02 |
0.01 |
0.00 |
0.04 |
14.57 |
0.16 |
0.02 |
0.11 |
0.12 |
0.03 |
0.08 |
0.16 |
0.27 |
0.12 |
0.07 |
0.57 |
|
10Russia |
0.00 |
0.05 |
0.03 |
0.02 |
0.03 |
0.10 |
0.00 |
0.01 |
0.11 |
13.53 |
0.02 |
0.06 |
0.07 |
0.03 |
0.02 |
0.05 |
0.09 |
0.05 |
0.04 |
0.31 |
|
11China |
0.00 |
0.01 |
0.00 |
0.00 |
0.00 |
0.00 |
0.00 |
0.02 |
0.01 |
0.02 |
11.10 |
0.01 |
0.03 |
0.03 |
0.01 |
0.03 |
0.01 |
0.00 |
0.01 |
0.08 |
|
12Canada |
0.01 |
0.03 |
0.00 |
0.02| |
0.02 |
0.04 |
0.00 |
0.04 |
0.14 |
0.06 |
0.01 |
9.03 |
0.14 |
0.09 |
0.22 |
0.18 |
0.23 |
1.09 |
0.13 |
0.99 |
|
13France |
0.00 |
0.03 |
0.02 |
0.01 |
0.01 |
0.03 |
0.00 |
0.01 |
0.05 |
0.04 |
0.01 |
0.15 |
6.31 |
2.30 |
2.22 |
0.03 |
1.18 |
0.24 |
0.35 |
2.69 |
|
14Germany |
0.01 |
0.02 |
0.01 |
0.00 |
0.03 |
0.04 |
0.00 |
0.01 |
0.03 |
0.08 |
0.02 |
0.08 |
1.75 |
8.12 |
1.26 |
0.06 |
1.18 |
0.38 |
0.28 |
2.11 |
|
15Italy |
0.02 |
0.04 |
0.01 |
0.01 |
0.03 |
0.06 |
0.00 |
0.02 |
0.05 |
0.07 |
0.00 |
0.19 |
2.49 |
1.66 |
8.76 |
0.06 |
0.69 |
0.24 |
0.31 |
2.40 |
|
16Japan |
0.03 |
0.00 |
0.01 |
0.00 |
0.01 |
0.01 |
0.00 |
0.04 |
0.10 |
0.03 |
0.04 |
0.08 |
0.02 |
0.07 |
0.09 |
11.43 |
0.04 |
0.07 |
0.04 |
0.27 |
|
17UK |
0.01 |
0.06 |
0.02 |
0.02 |
0.04 |
0.02 |
0.00 |
0.02 |
0.16 |
0.06 |
0.01 |
0.33 |
0.95 |
0.87 |
0.60 |
0.07 |
10.04 |
0.68 |
0.22 |
1.67 |
|
18USA |
0.00 |
0.04 |
0.00 |
0.05 |
0.00 |
0.01 |
0.00 |
0.05 |
0.13 |
0.05 |
0.03 |
0.50 |
0.09 |
0.20 |
0.10 |
0.14 |
0.33 |
9.41 |
0.10 |
0.74 |
|
TO_ABS |
0.02 |
0.03 |
0.02 |
0.03 |
0.03 |
0.03 |
0.01 |
0.03 |
0.05 |
0.04 |
0.01 |
0.09 |
0.32 |
0.30 |
0.27 |
0.05 |
0.24 |
0.17 |
1.76 |
|
|
TO_WTH |
0.12 |
0.26 |
0.15| |
0.27 |
0.23 |
0.23 |
0.08 |
0.21 |
0.42 |
0.33 |
0.09 |
0.72 |
2.47 |
2.31 |
2.08 |
0.40 |
1.82 |
1.30 |
13.46 |
|
|
NET |
-0.01 |
0 |
0 |
0.01 |
0 |
-0.01 |
0 |
-0.01 |
-0.02 |
0 |
0 |
-0.04 |
-0.03 |
0.02 |
-0.04 |
0.01 |
0.02 |
0.07 |
Note. Table 4(c) displays (BK-18) medium-term volatility spillover from markets in selected regions, calculated by net spillovers (TO-ABS) minus (FROM-ABS).
Table 4(d)
Barunik–Krehlik Spillover Method (BK-18)—Spillover Band: 0.31–0.00; corresponds to 10 days to infinite days (Long-term)
|
1 |
2 |
3 |
4 |
5 |
6 |
7 |
8 |
9 |
10 |
11 |
12 |
13 |
14 |
15 |
16 |
17 |
18 |
FROM_ABS |
FROM_WTH |
|
|
1Bahrain |
66.33 |
3.64 |
0.32 |
0.16 |
0.14 |
0.28 |
0.01 |
0.22 |
0.12 |
0.02 |
0.02 |
0.11 |
0.05 |
0.15 |
0.32 |
0.19 |
0.13 |
0.02 |
0.33 |
0.41 |
|
2Kuwait |
0.14 |
74.64 |
0.97 |
1.46 |
0.54 |
0.04 |
0.03 |
0.06 |
0.43 |
0.50 |
0.06 |
0.09 |
0.39 |
0.17 |
0.44 |
0.01 |
0.50 |
0.42 |
0.35 |
0.44 |
|
3Oman |
0.26 |
0.79 |
74.10 |
1.50 |
1.22 |
0.15 |
0.18 |
0.04 |
0.47 |
0.28 |
0.01 |
0.04 |
0.21 |
0.12 |
0.18 |
0.15 |
0.29 |
0.17 |
0.34 |
0.42 |
|
4Qatar |
0.09 |
2.18 |
0.77 |
77.12 |
0.44 |
0.39 |
0.31 |
0.25 |
0.38 |
0.31 |
0.00 |
0.15 |
0.00 |
0.02 |
0.06 |
0.00 |
0.15 |
0.41 |
0.33 |
0.41 |
|
5Saudia |
0.12 |
3.84 |
1.23 |
8.36 |
63.40 |
0.60 |
0.18 |
0.57 |
0.87 |
0.55 |
0.09 |
0.17 |
0.16 |
0.36 |
0.45 |
0.35 |
0.75 |
0.62 |
1.07 |
1.34 |
|
6UAE |
0.37 |
2.49 |
0.74 |
11.32 |
0.89 |
60.69 |
0.07 |
0.12 |
0.30 |
2.00 |
0.33 |
0.52 |
0.38 |
0.45 |
0.64 |
0.63 |
0.37 |
0.30 |
1.22 |
1.53 |
|
7Pakistan |
0.03 |
0.10 |
0.25 |
2.71 |
0.61 |
0.05 |
73.76 |
0.55 |
0.04 |
0.03 |
0.02 |
0.04 |
0.01 |
0.01 |
0.00 |
0.04 |
0.10 |
0.09 |
0.26 |
0.33 |
|
8India |
0.37 |
0.28 |
0.46 |
0.56 |
0.57 |
0.54 |
0.32 |
59.91 |
0.89 |
0.70 |
0.86 |
1.52 |
0.30 |
0.30 |
0.48 |
5.40 |
0.62 |
2.20 |
0.91 |
1.14 |
|
9Brazil |
0.12 |
0.95 |
0.78 |
1.04 |
0.98 |
0.16 |
0.01 |
0.37 |
55.49 |
2.91 |
1.08 |
0.97 |
0.84 |
0.41 |
0.69 |
4.67 |
2.10 |
1.31 |
1.08 |
1.35 |
|
10Russia |
0.08 |
0.51 |
0.20 |
0.14 |
0.24 |
0.58 |
0.00 |
0.09 |
0.89 |
68.24 |
0.74 |
0.98 |
0.50 |
0.33 |
0.29 |
2.54 |
0.74 |
0.67 |
0.53 |
0.66 |
|
11China |
0.02 |
0.15 |
0.01 |
0.05 |
0.56 |
0.01 |
0.09 |
0.18 |
0.09 |
0.18 |
78.53 |
0.13 |
0.33 |
0.52 |
0.15 |
0.52 |
0.23 |
0.07 |
0.18 |
0.23 |
|
12Canada |
0.16 |
1.67 |
0.20 |
0.75 |
0.87 |
0.52 |
0.01 |
0.76 |
3.74 |
2.42 |
1.56 |
38.02 |
1.11 |
1.10 |
1.41 |
11.33 |
2.67 |
14.47 |
2.49 |
3.12 |
|
13France |
0.08 |
0.71 |
0.14 |
0.04 |
0.33 |
0.33 |
0.00 |
0.44 |
1.72 |
1.96 |
1.45 |
4.36 |
17.55 |
12.40 |
9.83 |
6.07 |
12.39 |
10.87 |
3.51 |
4.40 |
|
14Germany |
0.10 |
0.70 |
0.13 |
0.25 |
0.39 |
0.34 |
0.00 |
0.45 |
1.61 |
2.53 |
1.84 |
3.61 |
6.69 |
24.62 |
4.79 |
6.79 |
11.62 |
13.01 |
3.05 |
3.82 |
|
15Italy |
0.16 |
0.63 |
0.14 |
0.19 |
0.34 |
0.42 |
0.00 |
0.42 |
1.36 |
2.84 |
1.01 |
3.35 |
9.94 |
7.68 |
29.41 |
5.73 |
7.13 |
7.28 |
2.70 |
3.39 |
|
16Japan |
0.19 |
0.09 |
0.09 |
0.01 |
0.13 |
0.11 |
0.00 |
0.32 |
0.75 |
0.33 |
1.70 |
0.69 |
0.36 |
0.79 |
1.18 |
73.29 |
0.56 |
0.70 |
0.45 |
0.56 |
|
17UK |
0.09 |
1.54 |
0.18 |
0.45 |
0.58 |
0.25 |
0.02 |
0.58 |
2.38 |
1.13 |
1.73 |
5.93 |
2.97 |
3.42 |
2.08 |
6.68 |
33.16 |
14.97 |
2.50 |
3.14 |
|
18USA |
0.04 |
0.61 |
0.08 |
0.50 |
0.26 |
0.15 |
0.00 |
1.12 |
3.31 |
1.64 |
3.41 |
6.49 |
0.34 |
1.03 |
0.14 |
9.35 |
2.59 |
51.89 |
1.73 |
2.17 |
|
TO_ABS |
0.13 |
1.16 |
0.37 |
1.64 |
0.50 |
0.27 |
0.07 |
0.36 |
1.07 |
1.13 |
0.88 |
1.62 |
1.37 |
1.63 |
1.28 |
3.36 |
2.38 |
3.75 |
22.99 |
|
|
TO_WTH |
0.17 |
1.45 |
0.47 |
2.06 |
0.63 |
0.34 |
0.09 |
0.46 |
1.35 |
1.42 |
1.11 |
2.03 |
1.72 |
2.04 |
1.61 |
4.22 |
2.99 |
4.71 |
28.86 |
|
|
NET |
-0.2 |
0.81 |
0.03 |
1.31 |
-0.57 |
-0.95 |
-0.19 |
-0.55 |
-0.01 |
0.6 |
0.7 |
-0.87 |
-2.14 |
-1.42 |
-1.42 |
2.91 |
-0.12 |
2.02 |
Note. Table 4(d) displays (BK-18) long-term volatility spillover from markets in selected regions, calculated by net spillovers (TO-ABS) minus (FROM-ABS).
Table 4 displays volatility spillover analysis for conventional stocks, with higher ‘FROM-ABS’ indicating shocks from other markets to market j.. Higher ‘TO-ABS’ indicating shocks from market j to other markets). We subtract (TO-ABS – FROM-ABS) to determine the net transmitter of shocks to other markets and net receiver of shocks from other markets by its values. The highest positive value shows the top highest transmitter of shocks to other markets and the highest negative value shows the top highest receiver of shocks from other markets. Total connectedness index or TCI can be calculated by the total of FROM-ABS/Total number of variables. TCI shows the return and volatility spillovers variations /in the markets. ‘TO-WITH’ and ‘FROM-WITH’ is unweighted connectivity in conventional stocks. The USA and Brazil are the largest transmitters of spillovers, followed by Japan and Russia. Canada, UK, and Italy are the largest net recipients. The USA and Brazil remain the largest net transmitter, while Canada and UK are the largest receivers. The USA has the most volatility in the US stock market, significantly impacting conventional stock markets, which aligns with the findings of Bossman et al. (2022).
Figure 7
(a). Conventional Stock Market (b). Conventional Stock Market Short-term Medium-term (c). Conventional Stock Market Long-term
Note. Figure 7(a-c) displays BK-18 return spillovers in short-, medium-, and long-term frequency bands. Black edge between USA (top net transmitter) and Canada (top net receiver). The red circle represents the highest net transmitter, while the green circle represents the highest net receiver. High spillovers are highlighted, with dark blue indicating high spillovers and light blue indicating low spillovers (Gephi 0.90).
Figure 8
(a). Conventional Stock Market (b). Conventional Stock Market Short-term Medium-term (c). Conventional Stock Market Long-term
Note. Figure 8(a-c) shows BK-18 volatility spillovers in short-, medium-, and long-term frequency bands. Black edge between Japan (top net transmitter) and France (top net receiver). Red circles indicate the highest net transmitter of shocks, while green circles indicate the highest net receiver. High spillovers are highlighted, with dark blue indicating high spillovers and light blue indicating low spillovers (Gephi 0.90).
Dynamic Returns Spillover
Figure 9
Conventional Stocks Return Spillover
Note. Figure 9 shows the dynamic overall return spillovers of conventional stock markets in selected regions (RStudio).
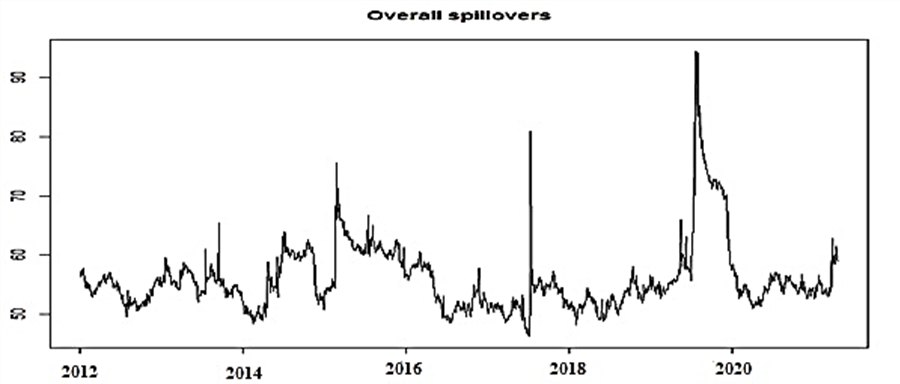
Dynamic Volatility Spillover
Figure 10
Conventional Stock Volatility Spillovers
Note. Figure 10 shows the dynamic overall volatility spillovers of the conventional stock market in selected regions.
The current study analyzes the return and volatility of conventional equity stock markets during two financial crises from 2012 to 2021. It finds a weak interconnectedness of return (1.32%) and volatility is 1.41%, with the USA being the highest net transmitter and Canada being the highest net receiver. Conventional stock market indices have low return TCI (1.32%), as /opposed to high volatility TCI (1.41%). Conventional stocks are not safe for investment decisions during crises, making them suitable for portfolio diversification (Babar et al., 2023).
The study reveals lower dynamic overall return spillovers for conventional stocks, but more pronounced volatility spillovers over time. Global events and the USA stock market significantly transmit returns and volatility to other countries, supporting the findings of Aziz et al. (2022) and Baker et al. (2020).
Between 2014 and 2015, crude oil prices dropped 60% due to US production of oil and technological innovation. Countries heavily reliant on oil, such as Saudi Arabia, Oman, UAE, and Kuwait, experienced higher losses. On the other hand, G7 countries must reduce oil consumption and develop renewable energy sources to combat inflation (Alqattan & Alhayky, 2016; Khan et al., 2019; Malik, 2016; Wen et al., 2021). Coronavirus has significantly impacted returns and volatility in conventional stock markets, with the pandemic causing greater impact, again supporting the findings of Aziz et al. (2022).
The results of this study have a significant impact on the financial economics literature. The study concludes that conventional markets are weakly interconnected and not safe for investment decisions. Portfolio managers can use this information regarding stock connection when predicting future co-movements, while policymakers need data and evidence on stock volatility during financial, energy, and health crises (Ali et al., 2022; Miniaoui et al., 2015).
Abbas, G., Hammoudeh, S., Shahzad, S. J. H., Wang, S., & Wei, Y. (2020). Return and volatility connectedness between stock markets and macroeconomic factors in the G-7 countries. Journal of Systems Science and Systems Engineering, 28, 1–36. https://doi.org/10.1007/s11518-018-5371-y
Agyei, S. K., Junior, P. O., Bossman, A., Asafo-Adjei, E., Asiamah, O., & Adam, A. M. (2022). Spillovers and contagion between BRIC and G7 markets: New evidence from time-frequency analysis. PLOS ONE, 17(7), Article e0271088. https://doi.org/10.1371/journal.pone.0271088
Alawi, S. M., Karim, S., Meero, A. A., Rabbani, M. R., & Naeem, M. A. (2023). Information transmission in regional energy stock markets. Environmental Science and Pollution Research, 30(15), 43000–43012. https://doi.org/10.1007/s11356-022-19159-1
Ali, S. R. M., Mensi, W., Anik, K. I., Rahman, M., & Kang, S. H. (2022). The impacts of COVID-19 crisis on spillovers between the oil and stock markets: Evidence from the largest oil importers and exporters. Economic Analysis and Policy, 73, 345–372. https://doi.org/10.1016/j.eap.2021.11.009
Alqattan, A. A., & Alhayky, A. (2016). Impact of oil prices on stock markets: Evidence from Gulf Cooperation Council (GCC) financial markets. Amity Journal of Finance, 1(1), 1–8.
Alsubaie, S. M., Mahmoud, K. H., Asafo-Adjei, E., & Bossman, A. (2023). Time-Frequency Connectedness between Shariah Indices in a systemic crisis era. Complexity in Finance and Economics, 2023, Article e5602895. https://doi.org/10.1155/2023/5602895
Antonakakis, N., & Gabauer, D. (2017). Refined measures of dynamic connectedness based on TVP-VAR. Munich Personal RePEc Archive Paper No. 78282. https://mpra.ub.uni-muenchen.de/78282/1/ MPRApaper_78282.pd
Aziz, M. I. A., Ahmad, N., Zichu, J., & Nor, S. M. (2022). The impact of COVID-19 on the connectedness of stock index in ASEAN+ 3 economies. Mathematics, 10(9), Article e1417. https://doi.org/10. 3390/math10091417
Babar, M., Ahmad, H., & Yousaf, I. (2023). Returns and volatility spillover between agricultural commodities and emerging stock markets: new evidence from COVID-19 and Russian-Ukrainian war. International Journal of Emerging Markets. Advance online publication. https://doi.org/10.1108/IJOEM-02-2022-0226
Baker, S. R., Bloom, N., Davis, S. J., Kost, K., Sammon, M., & Viratyosin, T. (2020). The unprecedented stock market reaction to COVID-19. The Review of Asset Pricing Studies, 10(4), 742–758. https://doi.org/10. 1093/rapstu/raaa008
Barunik, J., & Křehlik, T. (2018). Measuring the frequency dynamics of financial connectedness and systemic risk. Journal of Financial Econometrics, 16(2), 271–296. https://doi.org/10.1093/jjfinec/nby001
Ben Rejeb, A., & Arfaoui, M. (2019). Do Islamic stock indexes outperform conventional stock indexes? A state space modeling approach. European Journal of Management and Business Economics, 28(3), 301–322. https://doi.org/10.1108/EJMBE-08-2018-0088
Bossman, A. (2021). Information flow from COVID-19 pandemic to Islamic and conventional equities: an ICEEMDAN-induced transfer entropy analysis. Complexity, 2021, Article e4917051. https://doi.org/ 10.1155/2021/4917051
Bossman, A., Junior, P. O., & Tiwari, A. K. (2022). Dynamic connectedness and spillovers between Islamic and conventional stock markets: time-and frequency-domain approach in COVID-19 era. Heliyon, 8(4), Article e09215. https://doi.org/10.1016/j.heliyon.2022.e09215
Diebold, F. X., & Yilmaz, K. (2012). Better to give than to receive: Predictive directional measurement of volatility spillovers. International Journal of Forecasting, 28(1), 57–66. https://doi.org/10.1016/j.ijforecast.2011.02.006
Hasan, M. B., Mahi, M., Hassan, M. K., & Bhuiyan, A. B. (2021). Impact of COVID-19 pandemic on stock markets: Conventional vs. Islamic indices using wavelet-based multi-timescales analysis. The North American Journal of Economics and Finance, 58, Article e101504. https://doi.org/10.1016/j.najef.2021.101504
Khan, M. K., Teng, J. Z., & Khan, M. I. (2019). Asymmetric impact of oil prices on stock returns in Shanghai stock exchange: Evidence from asymmetric ARDL model. PLOS ONE, 14(6), Article e0218289. https://doi.org/10.1371/journal.pone.0218289
Liu, Y., Wei, Y., Wang, Q., & Liu, Y. (2022). International stock market risk contagion during the COVID-19 pandemic. Finance Research Letters, 45, Article e102145. https://doi.org/10.1016/j.frl.2021.102145
Malik, A. (2016). The impact of oil price changes on inflation in Pakistan. International Journal of Energy Economics and Policy, 6(4), 727–737.
Mensi, W., Vo, X. V., Ko, H. U., & Kang, S. H. (2023). Frequency spillovers between green bonds, global factors and stock market before and during COVID-19 crisis. Economic Analysis and Policy, 77, 558–580. https://doi.org/10.1016/j.eap.2022.12.010
Miniaoui, H., Sayani, H., & Chaibi, A. (2015). The impact of financial crisis on Islamic and conventional indices of the GCC countries. Journal of Applied Business Research, 31(2), 357–370. https://doi.org/10.19030/jabr.v31i2.9171
Panda, P., Vasudevan, S., & Panda, B. (2021). Dynamic connectedness among BRICS and major countries stock markets. Journal of Public Affairs, 21(3), Article e2265. https://doi.org/10.1002/pa.2265
Umar, Z., Adekoya, O. B., Gubareva, M., & Boubaker, S. (2023). Returns and volatility connectedness among the EurozoDne equity markets. International Journal of Finance & Economics. Advance online publication. https://doi.org/10.1002/ijfe.2816
Wen, F., Zhang, K., & Gong, X. (2021). The effects of oil price shocks on inflation in the G7 countries. The North American Journal of Economics and Finance, 57, Article e101391. https://doi.org/10.1016/j.najef.2021.101391
Zhang, W., Zhuang, X., & Wu, D. (2020). Spatial connectedness of volatility spillovers in G20 stock markets: Based on block models analysis. Finance Research Letters, 34, Article e101274. https://doi.org/10.1016/j.frl.2019.08.022