
| Review | Open Access |
|---|
Analyzing Global Economic Disparities and Growth |
 |
|---|
Sana Riaz1, Muhammad Zunnurain Hussain2*, Muhammad Zulkifl Hasan3, and Zaigham Riaz4
1Queen Marry College, Lahore, Pakistan
2Bahria University Lahore Campus, Lahore, Pakistan
3University of Central Punjab, Lahore, Pakistan
4National College of Business Administration & Economics, Lahore, Pakistan
The current study aimed to analyse global economic disparities through the lens of international classification systems, such as those of the United Nations, World Bank, and International Monetary Fund (IMF). Countries are grouped into developed, emerging, developing, and least developed economies based on indicators, such as Gross Domestic Product (GDP) per capita, GDP adjusted for Purchasing Power Parity (PPP), industrialization level, and human development indices. The research highlighted how such classifications reveal structural imbalances in global wealth, production, and living standards. Using 2022–2023 data, the study compared economic performance across major regional and institutional groups including the European Union (EU), the Group of Seven (G7), and fuel-exporting nations to identify key patterns of inequality and growth potential. Findings showed substantial variation in income distribution and productivity, underscoring the importance of targeted policy, investment, and development strategies. These insights contribute to a clearer understanding of how global classifications inform sustainable growth and international cooperation.
1. INTRODUCTION
Global economic classifications are essential to describe and explain the structure of the economic world. Countries are commonly grouped according to indicators such as Gross Domestic Product (GDP), income levels, industrialization, and human development. These classifications divide nations into categories such as developed, developing, least developed, and emerging markets, each exhibiting distinct patterns of growth and structural transformation (Barro, 2021). The developed economies—including the United States, Japan, and Germany—are characterized by high per-capita income, advanced industrial capacity, strong institutions, and high living standards (Porter, 1990; Jones).
In contrast, countries such as India, Indonesia, and Brazil are still undergoing industrialization and integration into global markets. Many continue to face persistent challenges of poverty, inequality, and underdeveloped infrastructure (Deaton, 2022). Least developed countries (LDCs), including Haiti, Chad, and Nepal, struggle with weak institutions, limited human capital, and heavy dependence on agriculture, which slows structural change and long-term growth (Pritchett, 2020). Emerging markets such as China, Turkey, and Mexico are shaped by rapid industrial expansion, growing middle classes, and increasing integration into global value chains (Subramanian 2020, Hausmann et al., 2014).
These classifications rely on indicators such as GDP, per-capita income, purchasing power parity (PPP), industrial composition, and economic diversification. They serve as analytical frameworks that support national planning, international aid allocation, foreign investment decisions, and development policy formulation (World Bank, 2022; UNCTAD, 2023). By highlighting global disparities and structural trends, economic classifications help identify the roots of inequality, trace developmental trajectories, and design policies that promote economic inclusion and long-term sustainability (Kuznets, 1955)
Literature Review
In the United Nations classification of 2014 countries are categorized based on multiple criteria, including the level of economic development, per capita income, industrialization, and key social indicators such as education, health, and living standards. This framework divides countries by their level of development into developed, developing, and least developed countries (LDCs) (World Bank, 2022).
The International Monetary Fund (IMF) classification of 2023 organizes national economies into categories such as developed, emerging, and developing. This classification provides valuable insights into the financial and economic status of nations from the perspective of one of the leading global financial institutions (Obstfeld, 2021; UNCTAD, 2023).
The Group of Seven (G7) represents a political and economic forum comprising the world’s most developed economies—namely the United States, Canada, Japan, the United Kingdom, France, Germany, and Italy. Membership in the G7 signifies substantial economic power and advanced development. Similarly, European Union (EU) membership designates whether a nation belongs to this regional bloc of European countries that share similar political and economic systems. EU membership brings economic privileges and responsibilities, such as access to a large single market and adherence to collective regulations (Porter, 1990; Reinhart & Rogoff, 2021).
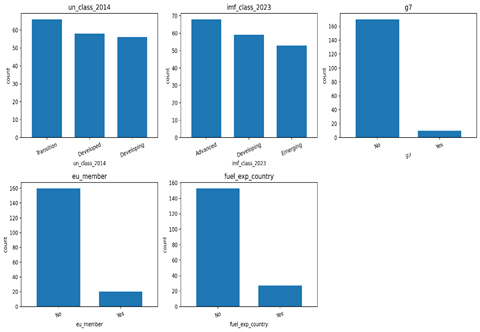
Figure 1
Distribution of Categorical Country-level Indicators, Including UN Development Classification (2014), IMF Economic Classification (2023), G7 Membership, EU Membership, and Fuel-exporter Status
The fuel-exporting country variable serves as a flag identifying whether a nation is a significant exporter of hydrocarbons, such as oil and natural gas. Heavy dependence on fuel exports can influence a country’s economic stability and long-term growth prospects (BP, 2023; International Energy Agency, 2023).
The wealth rank variable measures a country’s relative position in global wealth distribution, determined by indicators such as GDP, income per capita, or overall share of global wealth. A higher rank typically indicates a wealthier and more industrially advanced economy (Kuznets, 1955; Piketty, 2014).
The GDP PPP 2022 metric refers to gross domestic product adjusted for purchasing power parity for 2022, offering a more accurate comparison of living standards across countries by accounting for cost-of-living differences and inflation (Deaton, 2022; World Bank, 2022).
Figure 2
Distribution of Economic Indicators across Countries, Including Wealth Rank, GDP (PPP, 2022), and GDP Per Capita (2022).
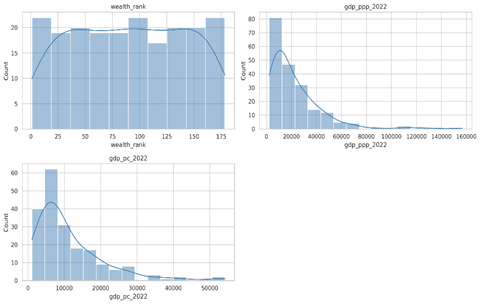
Each histogram shows the overall spread and skewness of the data, highlighting cross-country variation in economic performance. The accompanying image presents four histograms, each illustrating distinct datasets. The top-left plot of wealth rank shows a frequency distribution skewed to the right, suggesting a greater concentration among higher-ranked economies. The top-right plot of GDP PPP 2022 also exhibits right skewness, indicating that most countries have lower PPP-adjusted GDP values. Similarly, the bottom-left plot depicting GDP per capita 2022 shows a right-skewed distribution comparable to GDP PPP 2022. The bottom-right plot appears empty, with no data displayed. Collectively, these visualizations provide an overview of the distribution patterns and variability of wealth and GDP indicators in the dataset (Pritchett, 2020).
Another visualization features six horizontal bars, representing the distribution of countries across specific classifications. The first chart, based on the 2014 UN classification, reveals that over 100 countries are classified as developing, whereas developed and transition economies are fewer. The second chart, reflecting the IMF 2023 classification, indicates that most nations fall under the emerging economy category, followed by advanced and developing economies. The third chart, illustrating G7 membership, highlights the exclusivity of this group, with only a few member countries. The fourth chart shows that only about 30 countries belong to the EU, emphasizing its regional scope. The fifth chart identifies fuel-exporting countries, demonstrating that although most nations are not exporters, a significant portion rely heavily on energy resources for revenue. Together, these figures portray a comprehensive view of global economic categorizations—showing the dominance of developing and emerging economies, the selectiveness of elite economic groups such as the G7, and the regional integration represented by the EU (Hausmann et al., 2014; UNCTAD, 2023).
Figure 3 displays a set of bar graphs, each showing the number of countries belonging to particular economic groups. The charts indicate that most examined countries fall into the developing category, while only a small number qualify as developed or advanced economies. Transition economies and emerging markets also appear within the dataset, though in smaller proportions. Regionally, very few countries are part of elite economic groups such as the G7 or the European Union, and only a limited number are classified as significant fuel exporters. Overall, these diagrams reveal the unequal global distribution of wealth and highlight the structural differences that separate various types of national economies (Kuznets, 1955; Piketty, 2014).
Figure 3
Boxplots Illustrating the Distribution of GDP (PPP) and GDP Per Capita (2022) across UN (2014) and IMF (2023) Country Classifications

The plots highlight clear income disparities, with developed and advanced economies displaying significantly higher central tendencies and wider variability compared to developing and emerging groups. The image also presents four boxplots illustrating Gross Domestic Product per capita (GDP_PC_2022) and Gross Domestic Product at Purchasing Power Parity (GDP_PPP_2022), categorized by the United Nations (UN) 2014 classification and the International Monetary Fund (IMF) 2023 classification. The first two plots show GDP_PPP_2022 distributions across development categories, where advanced economies display much higher medians and larger spreads due to extremely wealthy outliers. In contrast, developing and emerging economies exhibit lower median values and reduced variability, reflecting more modest but relatively stable economic performance.
The lower two plots depict GDP per capita, an indicator closely linked to living standards. Here, advanced economies clearly dominate the upper range, showing both high medians and wide variation. These results underscore persistent disparities in income, productivity, and quality of life between advanced and developing nations. Although transition and emerging economies perform better than developing countries on average, they still lag significantly behind advanced economies in overall wealth accumulation and economic resilience (Hausmann et al., 2014; Pritchett, 2020).
Figure 4
Line Plot of GDP Per Capita (2022) Values Sorted in Descending Order
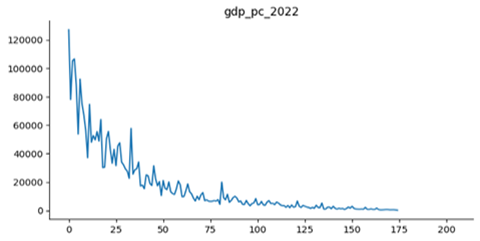
It is showing the steep inequality across countries, with a few nations exhibiting extremely high GDP per capita while the majority remain much lower. Taken together, the comparative patterns emphasize the long-standing hierarchical structure of the global economy. While upward mobility is visible for some emerging markets, full economic convergence remains limited. These visualizations reinforce the enduring gaps in economic performance across advanced, developing, and emerging economies, highlighting the ongoing reality of global inequality (Piketty, 2014).
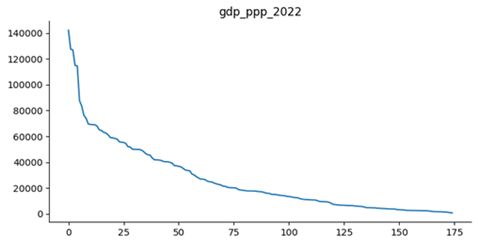
The curve in Figure 5 highlights a high concentration of economic output among the top-ranked countries, followed by a smooth downward gradient and a long tail of lower-PPP nations, reflecting asymmetric global economic distribution. The graph titled “gdp_pc_2022” represents the Gross Domestic Product (GDP) per capita for different countries in 2022. The X-axis denotes the ranked order of these countries, while the Y-axis displays GDP per capita in a common currency unit. The graphical trend shows that as the rank increases, GDP per capita declines sharply—from values above 120,000 down to much lower income levels. The curve also exhibits fluctuations, reflecting the presence of a few small, wealthy nations with exceptionally high GDP per capita despite their lower ranking positions. As the X-coordinate increases further, GDP per capita stabilizes around modest levels, typically near or below 10,000. This distribution is characteristic of global inequality, where only a handful of countries achieve very high income levels while the majority remain at much lower economic positions. Such disparities highlight the persistent imbalance in global wealth distribution and the uneven pace of economic development across nations (Kuznets, 1955 ; Piketty, 2014).
Figure 5
Sorted Line Plot of GDP Based on Purchasing Power Parity (GDP_PPP_2022)
The scatter plot titled “gdp_ppp_2022 vs gdp_pc_2022” compares nominal GDP per capita with GDP per capita adjusted for purchasing power parity (PPP) for the year 2022. Each point represents a country, positioned according to its nominal income and PPP-adjusted income. The plot exhibits a strong positive linear relationship, indicating that countries with high nominal GDP per capita also tend to have high PPP-adjusted GDP per capita. Most points cluster along a diagonal line from the bottom left to the top right, suggesting that for many countries, nominal income and PPP-adjusted income are broadly similar. However, several outliers in the upper-right corner display much higher nominal GDP per capita relative to their PPP-adjusted values. This mismatch implies higher domestic price levels and living costs, which reduce real purchasing power despite elevated nominal incomes. Countries positioned closer to the diagonal line demonstrate a more stable balance between nominal income and cost-of-living differences, reflecting more consistent purchasing power across domestic markets (Deaton, 2022).
The accompanying violin plot depicts the distribution of countries’ wealth rankings according to the IMF’s 2023 economic classification—advanced, emerging, and developing economies. The X-axis displays the wealth rank, where lower values correspond to higher levels of economic prosperity. The violin representing advanced economies is tightly clustered near the highest wealth ranks, indicating concentrated income and strong economic performance within this group. In contrast, emerging economies show a wider distribution, illustrating substantial variation in wealth levels and differing stages of economic maturation. Developing economies occupy the lower range of the distribution, consistent with their comparatively weaker economic performance. Overall, the visualization highlights the entrenched global income divide, where advanced economies dominate the upper end of the wealth spectrum, and emerging and developing economies remain significantly behind (Barro, 2021; Hausmann et al., 2014; Pritchett, 2020).
Figure 6
Violin Plot Illustrating the Distribution of Wealth Rankings across IMF Economic Classifications (Advanced, Emerging, Developing) in 2023

Methodology
The plot highlights the broader spread and mid-range concentration of wealth ranks among Emerging economies, tighter clustering for Advanced economies, and relatively sparse distribution for Developing nations. This study employed a quantitative descriptive approach to examine global economic disparities through internationally recognized economic classification systems. Such an approach aligns with established comparative development research, which emphasizes empirical measurement of income differences, structural variation, and long-term growth patterns across nations (Barro, 2021; Pritchett, 2020).
Data SourcesData was obtained from publicly accessible international economic databases, primarily those reporting standardized macroeconomic indicators and global development metrics. Key sources included the World Bank’s cross-country statistical datasets on income, inequality, and development (World Bank, 2022), as well as major international assessments of economic performance and structural conditions compiled by global institutions such as the IMF and UNCTAD, which track country classifications, GDP patterns, trade, and investment flows (Obstfeld, 2021; UNCTAD, 2023).
Time FrameThe analysis focused on the most recent available year—2022—supplemented by 2023 classification updates where necessary. This time frame reflects the period during which global income disparities, structural changes, and post-pandemic recovery trends became more visible .
Variables and IndicatorsThe following key indicators were analyzed:
- GDP per capita, a widely used measure of economic output per person and a core metric for comparing living standards across nations ( Deaton, 2022).
- GDP (PPP), which adjusts for purchasing power parity to facilitate cross-country comparisons by accounting for differences in price levels and inflation (Deaton, 2022).
- Wealth rank, an ordinal measure based on national income levels and used to position countries within the global distribution of economic performance (Piketty, 2014).
- Classification variables, including:
- UN development categories of developed, developing, and least developed countries (World Bank, 2022);
- IMF 2023 classifications of advanced, emerging, and developing economies (Obstfeld, 2021);
- EU membership as a regional integration indicator (Porter, 1990);
- G7 membership as a marker of advanced economic status;
- A fuel-exporting flag identifying nations reliant on hydrocarbons, a structural factor that heavily influences income volatility and long-term growth prospects (BP, 2023; International Energy Agency, 2023).
Countries were included only if complete data were available for GDP (nominal and PPP), development classification, and membership variables. Missing observations were excluded to maintain comparability across indicators—a standard practice in cross-country development and inequality studies (Deaton, 2022).
Analytical Approach- Descriptive statistics and comparative visualizations—including bar charts, boxplots, scatterplots, and histograms—were employed to:
- Compare GDP distributions across major classification groups;
- Identify outliers and assess disparities within and across development categories (Kuznets, 1955; Pritchett, 2020);
- Examine relationships between nominal GDP and PPP-adjusted GDP, reflecting differences in cost of living and domestic price structures (Deaton, 2022);
- Highlight structural variations in economic composition, such as degrees of industrialization, trade patterns, and resource dependence (Edwards, 2020; Hausmann et al., 2014).
Results
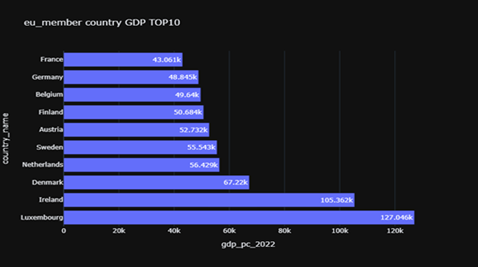
The bar chart illustrates the ten European Union (EU) member countries with the highest GDP per capita in 2022. The horizontal axis represents GDP per capita (in thousands of U.S. dollars), while the vertical axis lists the countries. The data reveal substantial variation among EU economies. Luxembourg leads with an impressive GDP per capita of approximately $127,046, followed by Ireland at $105,362, both far ahead of their European counterparts. Denmark occupies the third position with $67,220, which, though considerably lower than the two leaders, remains among the highest in Europe. The Netherlands, Sweden, and Austria follow closely, with GDP per capita figures ranging between $52,732 and $56,429.
Further down the list, Finland, Belgium, and Germany maintain relatively strong positions, with GDP per capita ranging from $48,845 to $50,684. France completes the top ten, recording a GDP per capita of $43,061, comparatively modest relative to the leading nations. The chart highlights significant disparities in economic development among the wealthiest EU states, with Luxembourg and Ireland standing out as the most affluent—largely due to their small populations, favorable tax regimes, and highly developed service and financial sectors (Hausmann et al., 2014; Jones; World Bank, 2022).
The subsequent bar chart presents the top ten EU member countries ranked by GDP (Purchasing Power Parity, PPP) for 2022. Luxembourg again tops the list, with an exceptionally high GDP (PPP) of $142.214k, reaffirming its status as the wealthiest EU country despite its small population. This exceptional performance can be attributed to its advanced financial services industry and international investment inflows. Ireland follows with $126.905k, supported by tax advantages, a strong technology-driven economy, and substantial foreign direct investment (FDI), particularly from global IT and pharmaceutical corporations (Hausmann et al., 2014; World Bank, 2022)
The subsequent bar chart presents the top ten EU member countries ranked by GDP (Purchasing Power Parity, PPP) for 2022. Luxembourg again tops the list, with an exceptionally high GDP (PPP) of $142.214k, reaffirming its status as the wealthiest EU country despite its small population. This exceptional performance can be attributed to its advanced financial services industry and international investment inflows. Ireland follows with $126.905k, supported by tax advantages, a strong technology-driven economy, and substantial foreign direct investment (FDI), particularly from global IT and pharmaceutical corporations (Zhao, 2023).
Figure 7
Sorted GDP (PPP) Values for 2022, Illustrating the Sharp Contrast between Top-performing Economies and the Long Tail of Countries with Substantially Lower Purchasing-Power-adjusted Output
Denmark ranks third with a GDP (PPP) of $74.005k, reflecting its diversified industrial base, high living standards, and well-developed welfare system. The Netherlands and Austria hold mid-range positions with $69.577k and $67.936k, respectively, supported by robust manufacturing, trade, and service sectors (Porter, 1990; Edwards, 2020). Belgium and Sweden follow closely, with GDP (PPP) levels of $65.027k and $64.578k, respectively. Belgium’s economic performance is strengthened by its central European location and extensive trade networks, whereas Sweden’s high GDP (PPP) reflects its innovation-driven industries and comprehensive welfare model.
Germany, the EU’s largest economy by absolute size, records a GDP (PPP) of $63.15k, slightly below Belgium and Sweden. This figure reflects the strength of Germany’s manufacturing and automotive industries but also points to relatively high production costs and taxation levels, which may constrain individual purchasing power. Collectively, these charts underscore the economic hierarchy within the EU, where small but financially dynamic countries such as Luxembourg and Ireland significantly outperform larger economies in per capita wealth and PPP-adjusted GDP (Barro, 2021; World Bank, 2022).
The final two countries in the list of the top ten EU members by GDP (PPP) in 2022 are Finland and Malta, with GDP (PPP) values of $59.027k and $55.928k, respectively. Both nations possess small populations and highly developed, industrialized economies emphasizing technology and comprehensive welfare systems. Malta, although the smallest economy among the listed countries, maintains a diversified economic structure encompassing tourism, financial services, and a growing digital and gaming industry (Hausmann et al., 2014; World Bank, 2022).
Figure 8
Top 10 Fuel-Exporting Countries by GDP per Capita (2022)
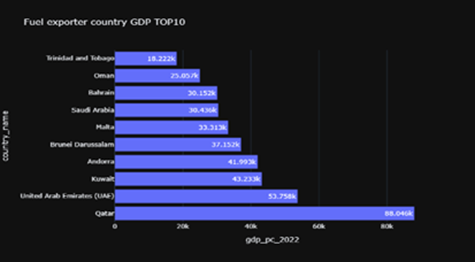
A subsequent bar chart highlights the ten largest fuel-exporting countries by GDP per capita in 2022, illustrating how hydrocarbon endowments translate into high income levels. Qatar leads this group with a GDP per capita (PPP) of $88.046k, far surpassing its peers. The Qatari economy is heavily dependent on its vast oil and natural gas reserves, ranking it among the wealthiest nations globally on a per capita basis. This wealth supports world-class infrastructure, healthcare, education, and social services. The United Arab Emirates (UAE) follows, with a GDP per capita (PPP) of $53.758k, reflecting a mixed yet highly developed economy. While crude oil exports—primarily from Abu Dhabi—remain vital, the UAE has also diversified significantly into tourism, finance, and real estate, thereby sustaining high per capita income (BP, 2023; International Energy Agency, 2023; UNCTAD, 2023)
Kuwait ranks third, with a GDP per capita (PPP) of $43.233k, its economy dominated by oil exports that contribute substantially to national income. The nation’s abundant reserves provide the foundation for sustained capital accumulation and economic stability. Andorra, a small state located in the Pyrenees, appears as an outlier in this list with a GDP per capita (PPP) of $41.993k; unlike traditional fuel exporters, its prosperity is associated more with tourism and financial services than hydrocarbons. Brunei Darussalam follows with a GDP per capita (PPP) of $37.152k, largely derived from its vast oil and gas reserves, which enable the government to maintain generous welfare provisions and very high living standards (BP, 2023; International Energy Agency, 2023).
Malta reappears in the comparison, registering a GDP per capita (PPP) of $33.313k. Despite lacking significant fuel resources, Malta sustains its prosperity through tourism, technology, and financial services, suggesting that its inclusion may reflect classification nuances or the impact of other high-value sectors. Saudi Arabia maintains a GDP per capita (PPP) of approximately $30.436k, underscoring its central role as one of the largest oil exporters in the Organization of the Petroleum Exporting Countries (OPEC). While the nation is pursuing Vision 2030–style reforms to diversify beyond hydrocarbons, petroleum remains its primary source of national revenue. Bahrain and Oman follow, with GDP per capita (PPP) values of $30.152k and $25.057k, respectively. Bahrain’s advanced financial sector supplements its moderate oil production, while Oman’s economy, though increasingly diversified, still depends heavily on petroleum exports (International Energy Agency, 2023; UNCTAD, 2023).
At the lower end of the ranking is Trinidad and Tobago, with a GDP per capita (PPP) of $18.222k, primarily derived from oil and natural gas exports that dominate its Caribbean-based economy (BP, 2023).
A complementary bar chart presents the ten leading fuel-exporting countries ranked by GDP (PPP) in 2022, which adjusts for cost of living and inflation to provide a more accurate measure of economic well-being. Qatar once again ranks first with a GDP (PPP) of $114.648k, reaffirming its position as one of the richest countries globally due to extensive oil and gas production. Its elevated GDP (PPP) highlights the substantial purchasing power and high standard of living of its citizens (BP, 2023; International Energy Agency, 2023).
The United Arab Emirates follows with a GDP (PPP) of $87.729k. Although the UAE has diversified across tourism, finance, real estate, and technology sectors, oil production—particularly from Abu Dhabi—remains the backbone of its economy. The country’s strategic diversification and global investment initiatives have reinforced its resilience against oil price volatility. Brunei Darussalam ranks third with a GDP (PPP) of $69.275k, continuing to rely on its hydrocarbon wealth while maintaining a small population and generous welfare system (UNCTAD, 2023)
Figure 9
Line Plot of GDP Per Capita (2022) Sorted in Descending Order
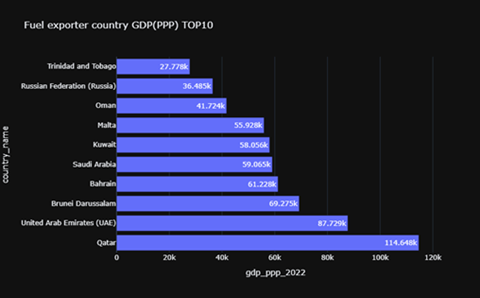
Bahrain achieves a GDP (PPP) per capita of $61.228k, sustained by a robust financial industry and oil revenues that contribute significantly to its high living standards. Saudi Arabia, the largest oil exporter globally, records a GDP (PPP) of $59.065k. Despite ongoing diversification efforts, the Saudi economy remains deeply tied to the energy sector. Kuwait, with a GDP (PPP) of $58.056k, similarly relies on oil exports to sustain its fiscal stability and high-income status (BP, 2023; International Energy Agency, 2023).
Malta, though small and lacking fossil resources, records a GDP (PPP) of $55.928k, driven by a mature service-oriented economy including tourism, financial services, and information technology. Its presence in this comparison underscores that high income can also be achieved through complex and diversified service economies (Hausmann et al., 2014; World Bank, 2022). Oman, with a GDP (PPP) of $41.724k, continues to pursue economic diversification while maintaining oil as a cornerstone of national income.
Russia ranks ninth with a GDP (PPP) of $36.051k. As one of the world’s largest producers and exporters of oil and natural gas, Russia’s economic performance remains closely linked to global energy markets; however, its large population moderates per capita income levels compared to smaller Gulf states. Finally, Trinidad and Tobago completes the list with a GDP (PPP) of $27.778k, driven by its hydrocarbon exports, which dominate both GDP contribution and export revenues (BP, 2023; UNCTAD, 2023).
Overall, these comparisons emphasize the economic significance of energy exports in shaping national wealth, fiscal resilience, and living standards. While diversification efforts are evident among several nations, petroleum and natural gas continue to underpin prosperity in most fuel-exporting economies (BP, 2023; International Energy Agency, 2023).
The bar chart in Figure 10 illustrates the Gross Domestic Product (GDP) per capita adjusted for Purchasing Power Parity (PPP) for all Group of Seven (G7) nations in the fiscal year 2022. The G7 comprises seven of the world’s most advanced economies—the United States, Germany, Canada, France, the United Kingdom, Italy, and Japan. GDP per capita adjusted for PPP provides a more accurate measure of economic performance, as it accounts for differences in cost of living and inflation across countries. This adjustment enables a fairer comparison of productivity levels, real income, and living standards among the member economies (Deaton, 2022; World Bank, 2022).
In this comparison, the United States leads with the highest GDP per capita (PPP) of $76,399, reflecting its strong economic productivity and high-income base. Germany follows with a GDP per capita of approximately $63,150, while Canada ranks third at $58,400, closely followed by France, with $55,493. The United Kingdom trails slightly behind at $54,603. At the lower end of the distribution, Italy reports a GDP per capita (PPP) of $51,865, and Japan ranks last among the G7 countries with $45,573.
Figure 10
GDP (PPP) Per Capita Distribution across G7 Countries in 2022, Highlighting Significant Economic Disparities, with the United States Substantially Outperforming All Other Members
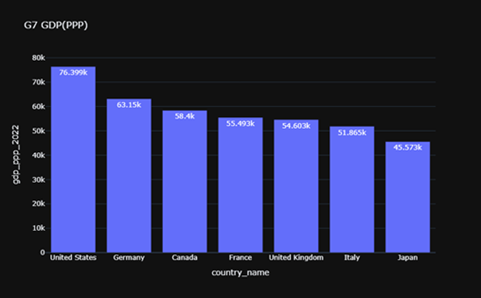
This bar chart highlights the economic divide among the G7 nations, demonstrating the United States’ continued dominance in per capita income and purchasing power. The observed variations in GDP per capita can be attributed to factors such as differences in labor productivity, employment rates, industrial composition, fiscal policies, and demographic characteristics (Barro, 2021). Overall, the visualization situates each G7 country within the context of its economic standing for 2022, revealing structural disparities despite their collective classification as advanced economies (Piketty, 2014).
The second bar chart shows the nominal GDP per capita of G7 countries in 2022. GDP per capita is one of the most widely used indicators of a country’s economic status, reflecting the economic output per person and, indirectly, the average income level of residents. Unlike GDP adjusted for PPP, nominal GDP per capita does not account for variations in the cost of basic goods and services across countries. Instead, it reflects the unadjusted monetary value of a nation’s total economic output divided by its population (Deaton, 2022).
Figure 11
GDP Per Capita (2022) of G7 Countries, Highlighting the United States as the Highest Performer Among the Group
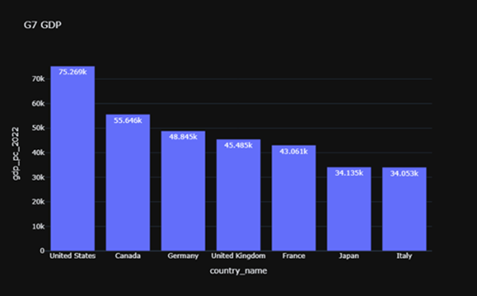
The chart reveals that the United States exhibits a significantly higher nominal GDP per capita of approximately $75,269, demonstrating its superior economic performance compared to other G7 countries. Canada follows with $55,646, indicating a considerable gap between the two North American economies. Germany ranks third with $48,845, closely followed by the United Kingdom, which records $45,485. France trails slightly with $43,061, while Japan and Italy occupy the lower positions among the G7 members, reporting $34,135 and $34,053, respectively. This distribution illustrates the economic disparities among the G7 nations, driven by differences in industrial capacity, productivity, demographic trends, and long-term growth performance (Barro, 2021).
The United States’ dominance can be attributed to its diversified economy, advanced technological infrastructure, and high levels of innovation, which collectively bolster its global economic leadership. Conversely, Japan and Italy, though still among the world’s largest economies, exhibit relatively lower GDP per capita figures and face challenges such as sluggish growth and aging populations (Pritchett, 2020)
Figure 12
Distribution of Average GDP (PPP) Across IMF Classification 2023 Categories
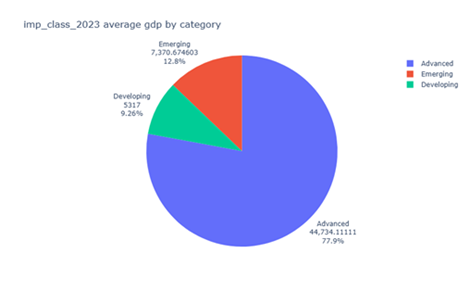
The accompanying pie chart visualizes the average global GDP for 2023, categorized into advanced, emerging, and developing economies. Each segment represents the proportional share of global GDP attributed to these classifications, highlighting persistent economic inequality and the concentration of wealth among advanced economies.
The “advanced” economies dominate the chart, accounting for a large share of global GDP, with high average income levels, robust infrastructure, and diversified industrial structures. Their substantial share of global output underscores the economic strength and global influence of developed nations (Piketty, 2014; World Bank, 2022). These countries typically exhibit technological advancement, efficient governance, and stable financial systems that collectively sustain their dominant position in global economic affairs.
The “emerging” economies constitute a smaller yet significant share of global GDP and record intermediate levels of average income. These economies are characterized by rapid industrialization, expanding infrastructure, and increasing integration into global trade networks. Although still less economically mature than advanced economies, emerging markets often exhibit higher growth rates, reflecting their potential to narrow the development gap in the coming decades .
The “developing” economies contribute a relatively modest share of global GDP despite comprising a large proportion of the world’s population. These nations are typically marked by low-income levels, limited industrial diversification, and ongoing struggles with poverty, inadequate infrastructure, and restricted access to quality education and healthcare. The chart underscores that a substantial share of countries generates only a small fraction of global income, highlighting stark inequality in economic capacity and living standards (Deaton, 2022; World Bank, 2022).
Figure 13
Distribution of Average GDP(PPP) in 2023 Across IMF Economic Classifications
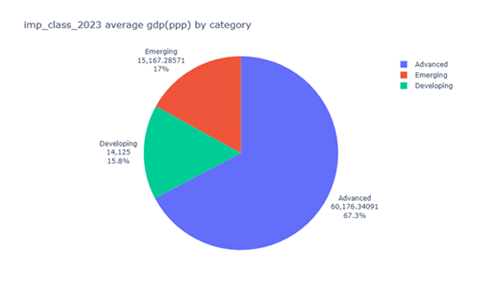
The second pie chart, illustrating average GDP (PPP) by classification for 2023, reinforces this disparity. Advanced economies again account for the majority of global PPP-adjusted GDP, reflecting their strong industrial bases, advanced technological sectors, and mature service industries. Emerging economies occupy an intermediate position, while developing economies capture only a small share, despite larger populations (Piketty, 2014; Pritchett, 2020).
Overall, both visualizations depict the persistence of global economic inequality, where developed economies retain substantial control over global production and income, while emerging and developing nations continue striving for convergence and sustainable growth. This pattern indicates that differences in development stages, institutional quality, and structural diversification remain deeply entrenched in the world economy (Kuznets, 1955; Piketty, 2014; Pritchett, 2020).
The “advanced” economies dominate the chart, accounting for approximately 77% of the global total GDP, with an average GDP of about $44,734. This segment, represented in blue, reflects nations with high income levels, robust infrastructure, and diversified industrial structures (Porter, 1990; World Bank, 2022). Their substantial share of global GDP underscores the economic strength and global influence of developed nations. These countries typically exhibit technological advancement, efficient governance, and stable financial systems that collectively sustain their dominant position in global economic affairs (Schwab, 2015).
The “emerging” economies, shown in red, constitute approximately 12% of the total GDP and record an average GDP of around $7,370.67. These economies are characterized by rapid industrialization, expanding infrastructure, and increasing integration into global trade networks. Although still less economically mature than advanced economies, emerging markets often exhibit higher growth rates, reflecting their potential to narrow the development gap in the coming decades. Their expansion signals transitional progress from developing to more industrialized and stable economic systems, though many remain vulnerable to external shocks and capital volatility ( Rodrik, 2022).
The “developing” economies, represented in green, contribute around 26% of the total average GDP, with an average GDP of approximately $5,317. Despite comprising a large proportion of the global population, these nations command a disproportionately small share of global wealth. Developing economies are typically marked by low income levels, limited industrial diversification, and ongoing struggles with poverty, inadequate infrastructure, and restricted access to quality education and healthcare. The chart indicates that a substantial share of the world’s nations generates only a small fraction of global income, highlighting stark inequality in economic capacity and living standards (Deaton, 2022; Milanovic, 2022; World Bank, 2022).
The second pie chart, illustrating average GDP (PPP) by classification for 2023, reinforces this disparity. The blue segment, representing advanced economies, shows an average GDP (PPP) of $60,176, comprising 67% of global GDP. This figure demonstrates the overwhelming economic dominance of high-income countries, which maintain strong industrial bases, advanced technological sectors, and mature service industries that collectively account for the majority of global economic output ( Piketty, 2014).
The red segment, corresponding to emerging economies, displays an average GDP (PPP) of $15,167, accounting for 17% of global GDP. These economies continue their transition toward industrialization, reflecting increasing participation in global value chains, progressive economic diversification, and steady integration with international markets. Despite being significantly smaller in scale than developed nations, emerging economies play a pivotal role in global growth momentum and cross-regional trade.
Overall, both visualizations depict the persistence of global economic inequality, where developed economies retain substantial control over global production and income, while emerging and developing nations continue striving for convergence and sustainable economic growth (Piketty, 2014; Pritchett, 2020).
The green segment represents developing economies, with an average GDP (PPP) of approximately 14,125, accounting for no more than 8% of total global GDP. These economies are typically characterized by low income levels, limited industrialization, and slower growth rates compared to their emerging and advanced counterparts. As a result, they hold only a modest share of world output, despite often having large populations. Moreover, developing countries face persistent challenges—such as structural poverty, weak institutions, inadequate infrastructure, and constrained access to quality education and healthcare—that hinder their ability to accelerate economic growth and improve overall welfare (Deaton, 2022; World Bank, 2022).
In contrast, advanced economies control a much larger share of global GDP than both emerging and developing economies, even though the latter are currently growing at faster rates. This pattern highlights how global economic inequality remains deeply entrenched, and how substantial differences in development stages continue to separate the world’s economies (Kuznets, 1955; Pritchett, 2020; Piketty, 2014).
Conclusion
Classification of the world economy remains a very important and useful way to explain the differences in the economic map of the world. They assist the decision-makers, financiers, and institutions about the position of the countries and areas in the world economy including the capabilities, vulnerabilities, and opportunities. Through focusing on evaluation of economic differentiation and developmental tendencies, these classifications have a rather important function in responding to imbalance in the world and cooperation between states.
Conflict of Interest
The authors of the manuscript have no financial or non-financial conflict of interest in the subject matter or materials discussed in this manuscript.
Data Availability Statement
Data supporting the findings of this study will be made available by the corresponding author upon request.
Funding Details
No funding has been received for this research.
REFERENCES
Barro, R. (2021). Economic growth in a cross section of countries. Quarterly Journal of Economics, 106, 407–443. https://doi.org/10.2307/2937943
BP. (2023). Statistical review of world energy 2023. https://www.bp.com/en/global/corporate/energy-economics/statistical-review-of-world-energy.html
Deaton, A. (2022). Measuring poverty in a growing world. The Review of Economics and Statistics, 87(1), 1–19. https://doi.org/10.1162/0034653053327612
Edwards, S. (2020). Openness, trade liberalization, and growth in developing countries. Journal of Economic Literature, 31(3), 1358–1393.
Hausmann, R., Hidalgo, C. A., Bustos, S., Coscia, M., & Simoes, A. (2014). The atlas of economic complexity. MIT Press.
International Energy Agency. (2023). World energy outlook 2022. https://www.iea.org/weo
Kuznets, S. (1955). Economic growth and income inequality. American Economic Review, 45(1), 1–28. https://www.jstor.org/stable/1811581
Piketty, T. (2014). Capital in the twenty-first century. Harvard University Press.
Porter, M. (1990). Competitive advantage of nations. Harvard Business Review. https://hbr.org
Pritchett, L. (2020). Divergence, big time. Journal of Economic Perspectives, 11(3), 3–17. https://doi.org/10.1257/jep.11.3.3
Reinhart, C., & Rogoff, K. (2021). The aftermath of financial crises. American Economic Review, 99(2), 466–472. https://doi.org/10.1257/aer.99.2.466
Rodrik, J. (2022). Industrial policy and development. Harvard Kennedy School. https://drodrik.scholar.harvard.edu/publications
Schwab, K. (2015, December 12). The fourth industrial revolution: What it means and how to respond. Foreign Affairs. https://www.foreignaffairs.com/articles/2015-12-12/fourth-industrial-revolution
UNCTAD. (2023). World investment report 2023. https://unctad.org/wir
World Bank. (2022). Poverty and shared prosperity 2022. https://www.worldbank.org/en/publication/poverty-and-shared-prosperity